
Figure 4.
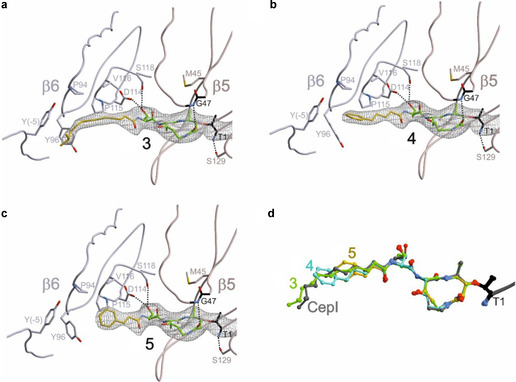
2F o−F c electron density maps (gray mesh: 1σ) of a) 3 (2.9 Å resolution, PDB ID: 6ZOU), b) 4 (2.8 Å resolution, PDB ID: 6ZP6) and c) 5 (3.0 Å resolution, PDB ID: 6ZP8) bound to the β5 subunit of yCP. The dotted lines indicate hydrogen bonding. Aliphatic tails are in yellow. d) Structural superposition of 2 (CepI, gray, PDB ID: 4FZC), 3 (green), 4 (blue), and 5 (yellow) bound to the Thr1 (black) of yCP β5 subunit.