Figure 2.

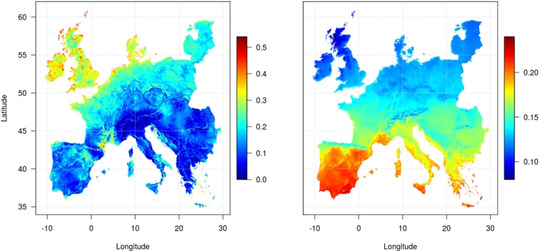
Average capacity factors for wind (left) and photovoltaics (right) in Europe (1995–2015). Reprinted from ref. [20] with permission.

Average capacity factors for wind (left) and photovoltaics (right) in Europe (1995–2015). Reprinted from ref. [20] with permission.