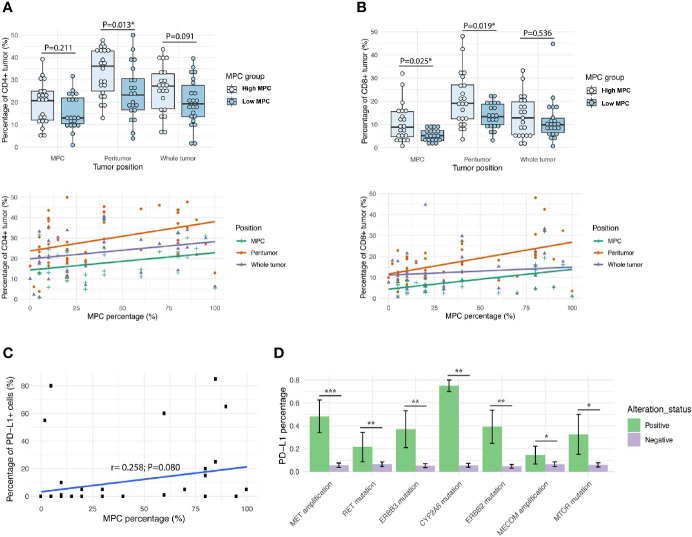
Figure 4.
LADC tumors with higher micropapillary contents have more T cell infiltration and immunosuppression. The pattern of immune cell infiltrations of CD4+ (A) and CD8+ (B) detected in different regions of tumor and comparison of micropapillary tumor content and the immunological markers. Upper panel: high MPC tumors vs. low MPC tumors; lower panel: the MPC percentage of the whole tumor. The Pearson’s coefficient value (r) and the corresponding P value were attached for each immunostaining; (C) The scatterplot of MPC percentage of the original tumor and the percentage of PD-L1+ cells within the MPC; (D) Graphs showing the top genetic alterations that were associated with the percentage of PD-L1+ tumors. *p < 0.05, **p < 0.01, and ***p < 0.001.

