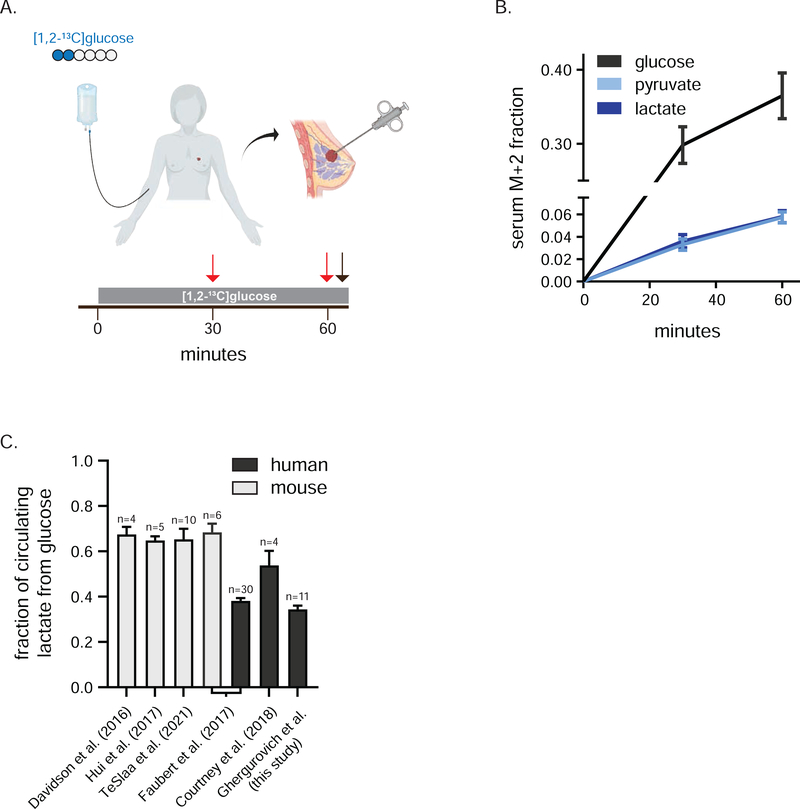
Figure 1. Infusion of [1,2-13C]glucose in patients with TNBC.
a) Infusion of [1,2-13C]glucose. Blue circles represent 13C, red arrows indicate serum collection and black arrow biopsy collection. b) Serum isotopic labeling of glucose, pyruvate and lactate from [1,2-13C]glucose during infusion (mean, ± 95% confidence interval, n = 12 at 30 min, n = 11 at 60 min, 3 technical replicates per patient). c) Average per carbon labeling of circulating lactate normalized to that of circulating glucose in indicated human and mouse infusion studies (mean ± SEM, n = number of individuals infused). See also Figure S1.

