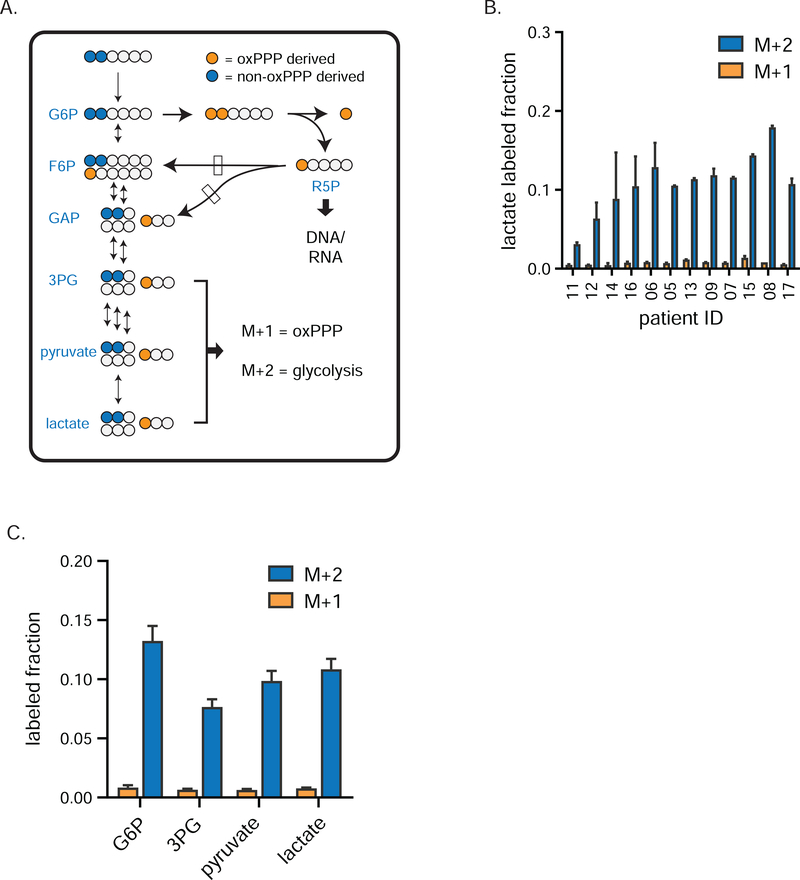
Figure 2. Glycolytic flux exceeds pentose phosphate activity in human breast tumors.
a) Tracer strategy for comparing glycolysis and pentose phosphate pathway flux using [1,2-13C]glucose. Blue circles depict glycolytic metabolites produced exclusively by glycolysis (M+2 labeling); orange circles depict glycolytic intermediates arising from glucose that first passed through the oxPPP (M+1). b) Individual patient M+1 and M+2 labeling of tumor lactate (mean ± SEM, n = 2 needle biopsy samples per patient), and c) M+1 and M+2 labeling of tumor glycolytic species (mean ± SEM, n = 24 total biopsy samples collected from twelve patients) from [1,2-13C]glucose. Dominance of M+2 fraction means that lower glycolytic intermediates are mainly from glycolysis, not oxPPP flux. G6P, glucose-6-phosphate; 3PG, 3-phosphoglycerate; R5P, ribose-5-phosphate and its isomers ribulose-5-phosphate and xyulose-5-phosphate. See also Figure S2.

