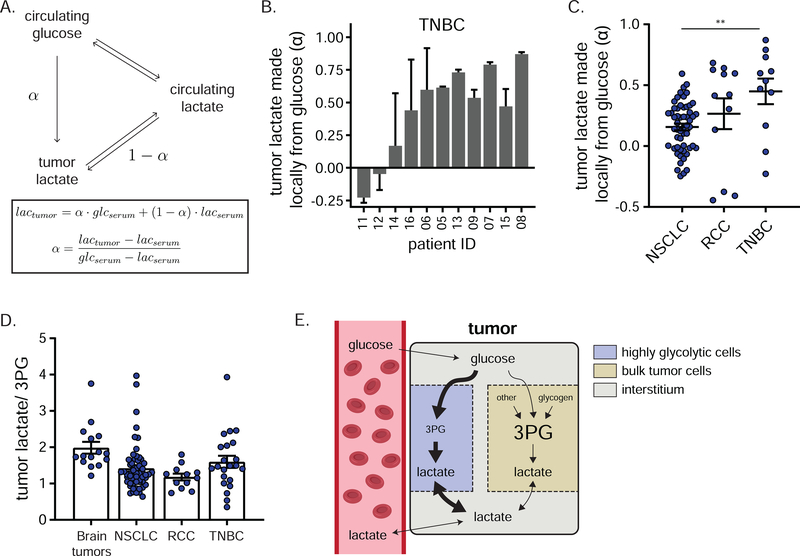
Figure 7. Evidence for local lactate production through a subset of tumor cells.
a) Model depicting sources of tumor lactate and associated equations for calculating the direct contribution of circulating glucose to tumor lactate, reflecting lactate made locally from glucose (α). b) Direct contribution of circulating glucose to tumor lactate (α) in TNBC (mean ± SEM, n = 2 biopsy samples per patient, 3 technical replicates for serum). c) Direct contribution of circulating glucose to tumor lactate (α) in the indicated cancers (mean ± SEM, each point represents a single tumor sample of several collected from each of 5 (brain), 30 (NSCLC), 5 (RCC) or 11 (TNBC) patients, one-way ANOVA w/ Tukey’s correction). d) Lactate/3PG labeling ratio in the indicated cancers (mean ± SEM, each point represents a single tumor sample of several collected from each of 5 (brain), 30 (NSCLC), 5 (RCC) or 12 (TNBC) patients). In line with published work, the lactate/3PG labeling ratio is calculated using the highest labeled forms of lactate and 3PG observed in each study (M+3 in NSCLC, brain tumors, and RCC; M+2 in TNBC). e) Schematic depicting proposed compartmentation of tumor glycolysis. See also Figure S7. ** = p < 0.01.

