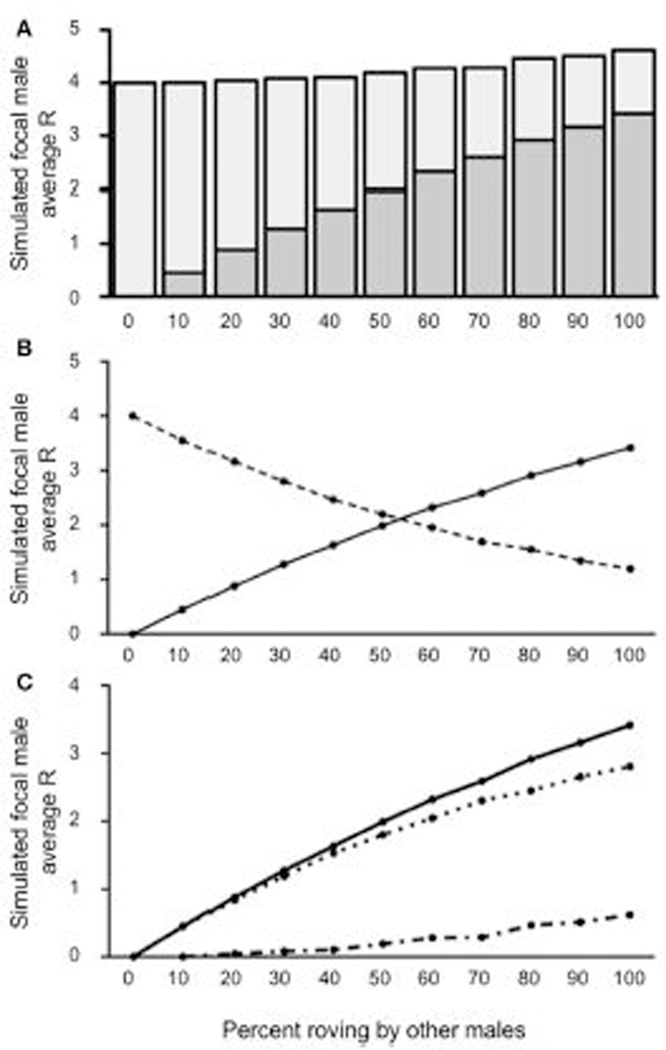
FIGURE 3 |.
Reproductive success for simulated roving focal male In Condition 1 at pair population 1,000. (A) Mean reproductive success (R) obtained by the simulated roving focal male at each percentage of roving In the population, split between R gained via extra-pair copulations (EPC; dark gray) and Intra-pair copulations (IPC; light gray). (B) Average R gained via EPCs (solid line) and IPCs (dashed line) by the simulated roving focal male as the percentage of roving In the population increases. (C) Average R gained via EPCs (, solid line), average R lost via cuckolding (, dotted line), and total change in R (ΔR, dash-dotted line) for the simulated roving focal male as the percentage of roving In the population increases.

