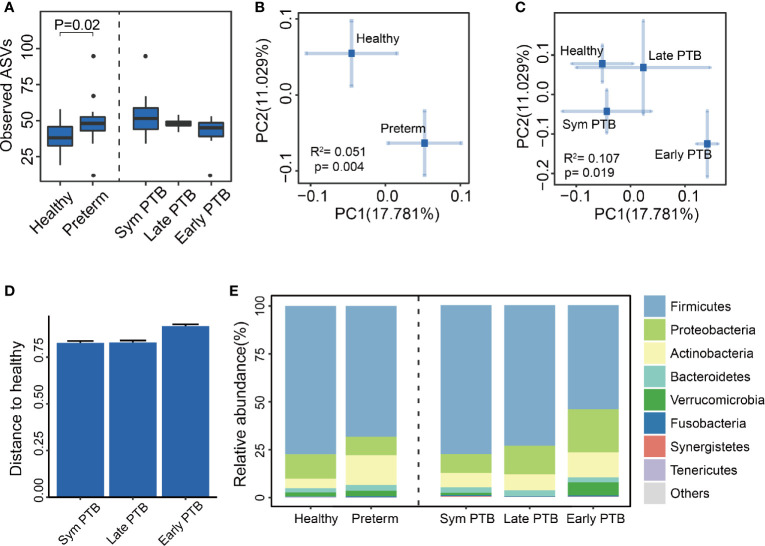
Figure 1.
The diversity and composition of the gut microbiome. (A) Observed ASVs of all groups. Observed ASVs between the healthy group and the preterm group (Wilcoxon rank-sum test), along with the preterm symptoms delivered group (Sym PTB), late-week preterm group (Late PTB) and early week preterm group (Early PTB). (Subgroups are compared with healthy group using Wilcoxon rank-sum test and adjusted by the Benjamini and Hochberg method). (B, C) Bray–Curtis distances PCoA of all groups. PCoA of Bray–Curtis distances for the bacterial community structure of the gut microbiome between the healthy group and the preterm group (B), the healthy group and the Sym PTB group and the late PTB group and the early PTB group. (C) The eigenvalues of axe PC1 and PC2 were 0.29 (17.781%) and 0.46 (11.029%), respectively. The eigenvalues of axe PC1 and PC2 were 0.60 (17.781%) and 0.97 (11.029%), respectively. PERMANOVA was employed. (D) Preterm subgroup distances to healthy group. The distance of the preterm birth subgroups to the healthy group, based on Bray–Curtis distances. (E) Relative abundance of all groups. Comparison of the relative abundance of the dominant phylum in the healthy group, the preterm group, and the preterm birth subgroups.

