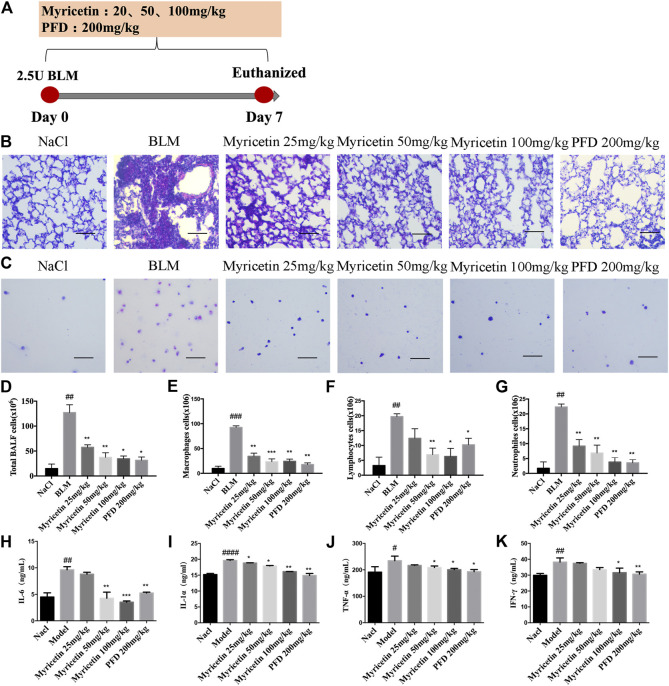
FIGURE 3.
Myricetin reduces the inflammatory response in BLM-treated mice. (A) Dosing regimen in BLM-induced inflammatory model. (B–C) H&E staining of left lung tissues (B, Scale: 50 μm) and inflammatory cells in BALF (C, Scale: 20 μm) of each group. (D) Total number of cells from BALF in each group. (E) Counts of macrophages in BALF. (F) Counts of lymphocytes in BALF. (G) Counts of Neutrophiles in BALF. (H–K) The expression of inflammatory factors including IL-6, IL-1α, TNF-α and IFN-γ in BALF were detected by ELISA. Data are shown as mean ± SD. # represent the difference between NaCl and BLM-treated group, ##P < 0.01, ###P < 0.001, ####P < 0.0001. * represent the difference between BLM-treated and treatment group, *P < 0.05, **P < 0.01, ***P < 0.001, ****P < 0.0001.

