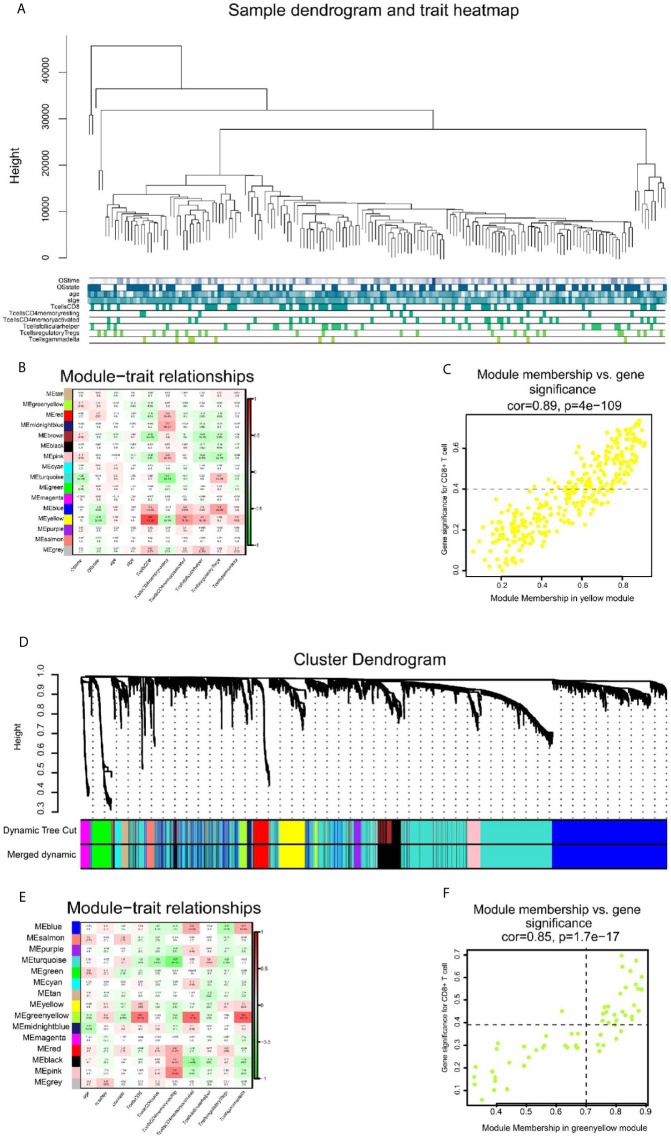
Figure 2.
The result of WGCNA analysis in SKCM-FPKM and GSE65904. (A) 470 samples were clustered according to cut Height = 46000, and a total of 177 samples were included. Tree and trait graphs of 177 samples are presented. (B) Correlation coefficients between different phenotypes and co-expression modules were shown. The yellow module had the highest correlation with CD8 cells (R = 0.69, P = 1e-26). (C) Gene significance for CD8+ T cell = 0.4, module membership in yellow module = 0.7 (cor = 0.89, P = 4e−109). (D) Hierarchical cluster trees are constructed by dynamic hybrid cutting method, in which each leaf represents a gene, and each branch represents a co-expression module. A total of 15 co-expression modules were produced. (E) Correlation coefficients between different phenotypes and co-expression modules were shown. The yellow-green modules had the highest correlation with CD8+ T cells (R² = 0.57, P = 4e-11) (F) Gene significance for CD8+ T cell = 0.4, module membership in green-yellow module=0.7. (cor = 0.85, p = 1.7e−17).

