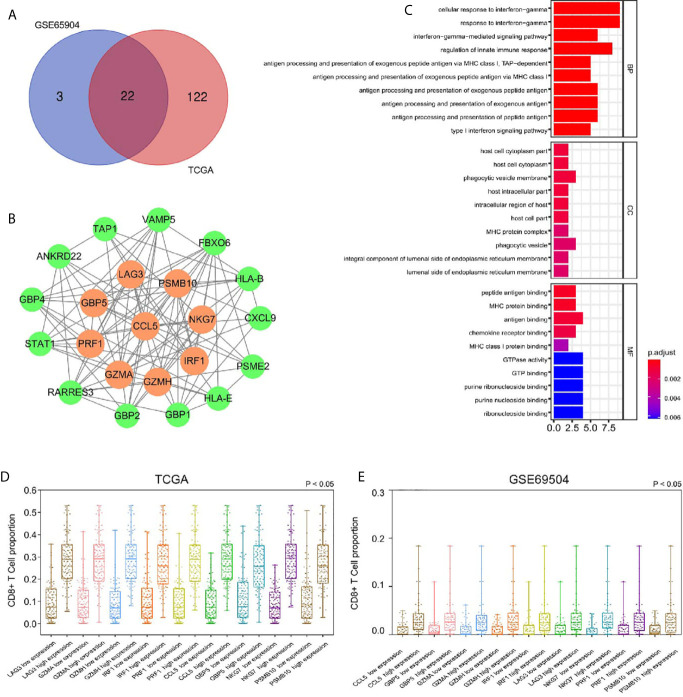
Figure 3.
(A) Identification of 22 factors in the intersection of the two modules. (B) The protein-protein network and the nine factors that were most closely connected. The orange circles represent nine genes with P-values less than 0.0001 in the survival analysis. The green circles represent other genes with P-values less than 0.05 but not less than 0.001 in the survival analysis. (C) According to GO analysis, in the BP, essential genes are enriched in the IFN-γ−mediated signaling pathway and antigen processing and presentation of exogenous antigen pathway. (D) The high expression group had a higher proportion of CD8+ T cells infiltration, suggesting that these genes related to CD8+ T cells infiltration in SKCM-FPKM. (E) The high expression group had a higher proportion of CD8+ T cells infiltration, suggesting that these genes related to CD8+ T cells infiltration in GSE65904.

