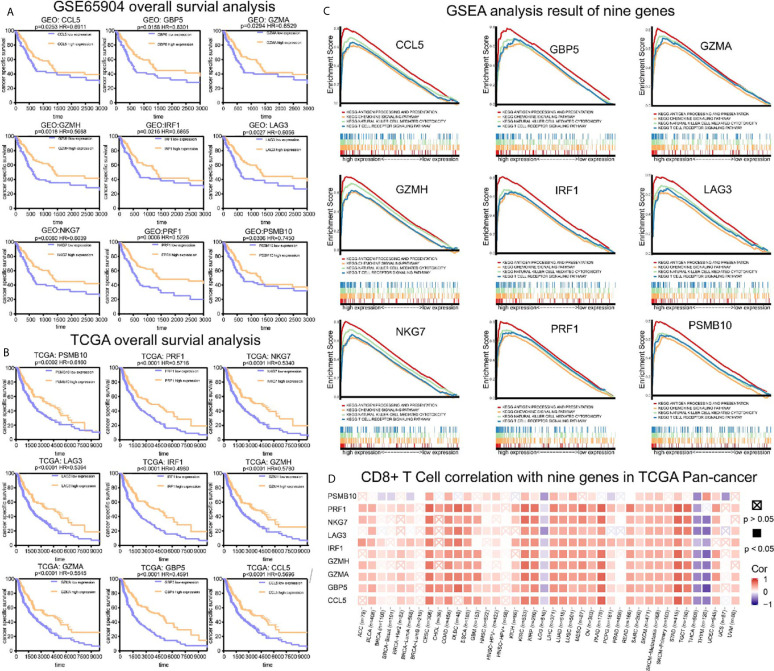
Figure 6.
Survival analysis, GSEA analysis, and pan-cancer analysis in TIMER. (A) Survival analysis results of nine co-expressed genes promoting CD8+ T cells infiltration in GSE65904. The survival rate of the high expression group was significantly higher than that of the low expression group. (B) Survival analysis results of nine co-expressed genes promoting CD8+ T cells infiltration in SKCM-FPKM. The survival rate of the high expression group was significantly higher than that of the low expression group. (C) Results of GSEA analysis. These genes are mainly concentrated in the T cell receptor signaling pathway, antigen processing presentation, chemokine signaling pathway, and cytotoxicity mediated by natural killer cells. (D) The relationship between CCL5, GBP5, GZMA, GZMH, IRF1, LAG3, NKG7, PRF1, and PSMB10 and CD8+ T cells infiltration in other cancers.

