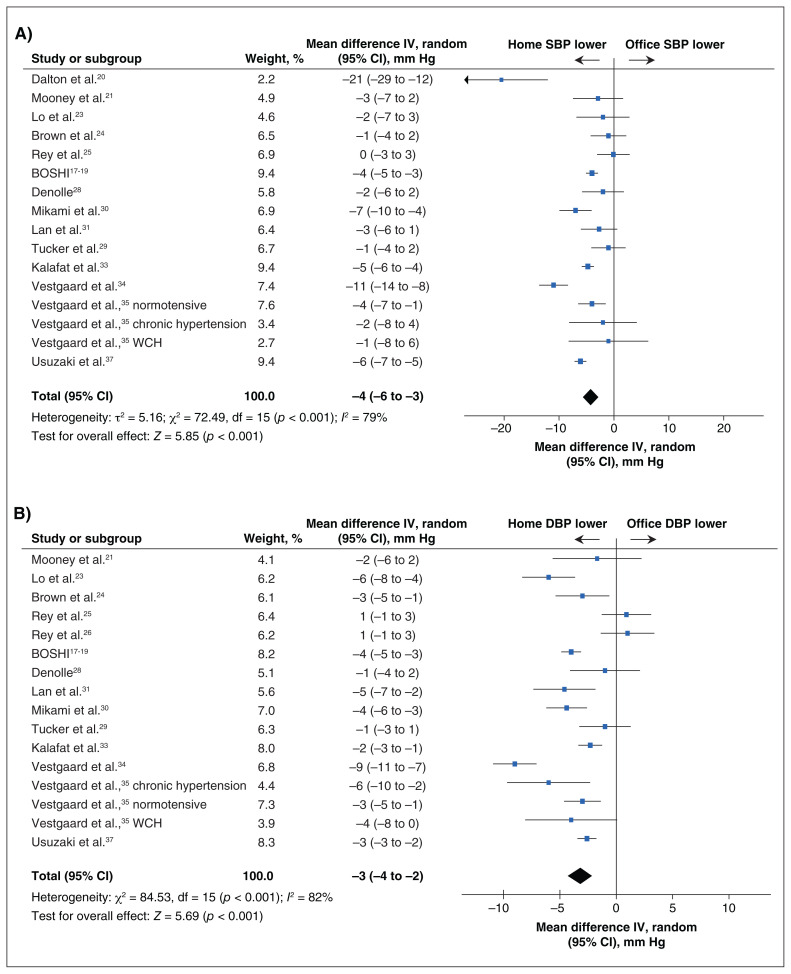
Figure 2:
Forest plots for comparison of differences in mean systolic blood pressure (SBP; panel A) and diastolic blood pressure (DBP; panel B) between home and office blood pressure measurements in pregnancy, using random effects. The mean difference was calculated as home BP – office BP. Note: CI = confidence interval, IV = inverse variance, WCH = white coat hypertension.

