
Figure 2 .
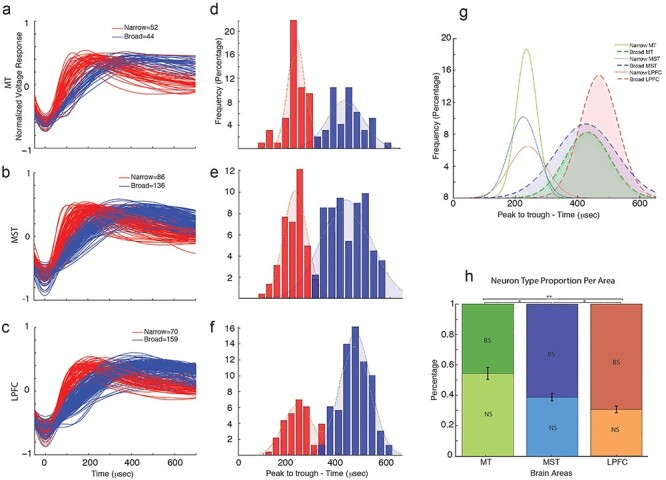
Classification of neurons into narrow spiking (NS) and broad spiking (BS). (a–c) Normalized average action potential waveforms for MT, MST, and LPFC, displaying NS (red) and BS (blue) waveforms. (d–f) Histograms showing the distribution of the trough-to-peak distance of the AP waveform. A Gaussian fit for each distinct population, with NS neurons in red and BS neurons in blue, is shown, with a bimodal distribution being observed for all areas. Hartigan’s dip and P value are shown for each area. (g) Gaussian functions fit to the different populations of neurons per area. Filled dashed lines represent BS distributions, solid lines represent NS distributions, and colors represent different brain areas. (h) Proportion of NS and BS neurons per area.