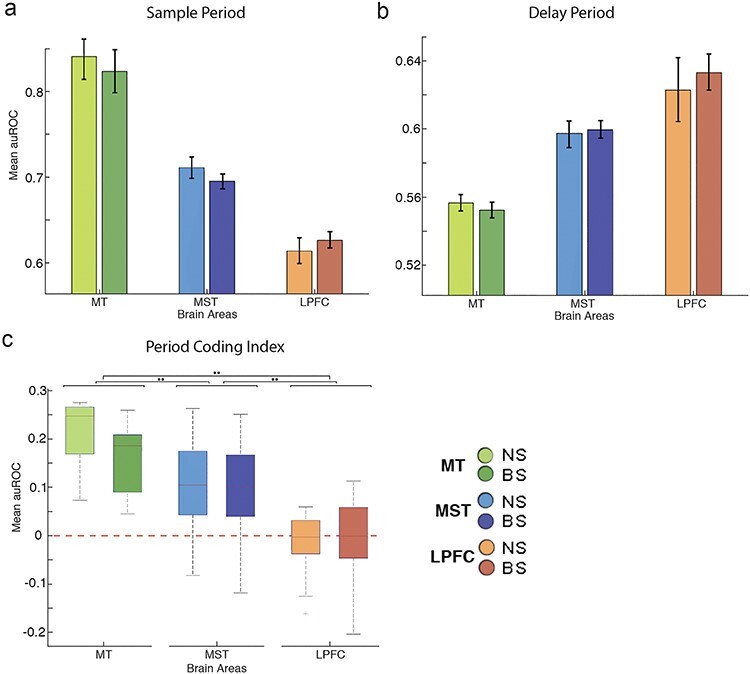
Figure 4 .

Period coding index (PCI). (a) Boxplot figures for PCI for all areas and neuron types. A value above 0 indicates a predominance of sensory coding over mnemonic coding. (b) Bar plot showing the proportion of neurons with reverse tuning per area. (c) Percentage of neurons displaying reverse tuning per neuron type for all areas.
