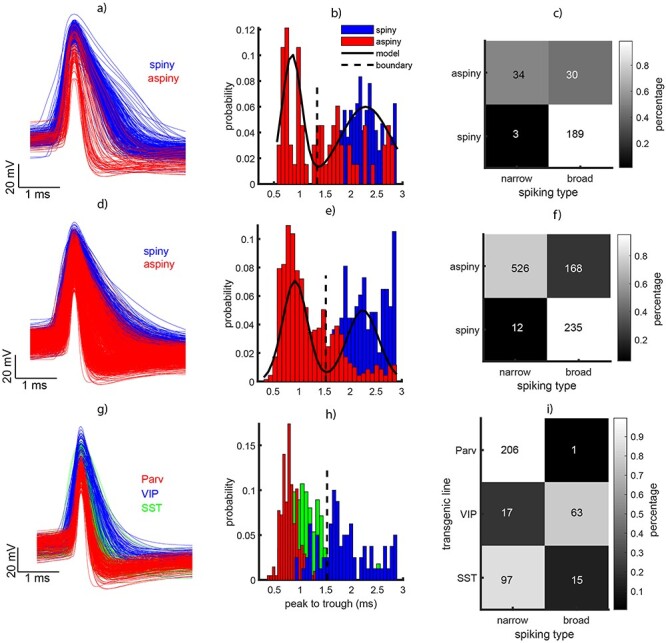
Figure 5 .

Analysis of waveform type in a sample of human and mouse neurons obtained during intracellular recordings (patch clamp) experiments. (a, d, g) Action potential waveforms at rheobase aligned to the deepest deflection of the waveform for human, mouse, and transgenic mouse, respectively. In a and d narrow spiking (NS) is shown in red and broad spiking (BS) neurons are shown in blue. In g the red indicates PV/PV cells, the green SST cells, and the blue VIP cells. (b, e, h) Histograms of waveform peak-to-trough for the data in the first column. (c, f) Dendritic type (spiny and aspiny) as a function of waveform type (NS and BS). The colors indicate the percentage of neurons. (i) Interneuron type from the transgenic lines (Parv/PV, VIP, and SST) as a function of spiking phenotype (NS and BS).
