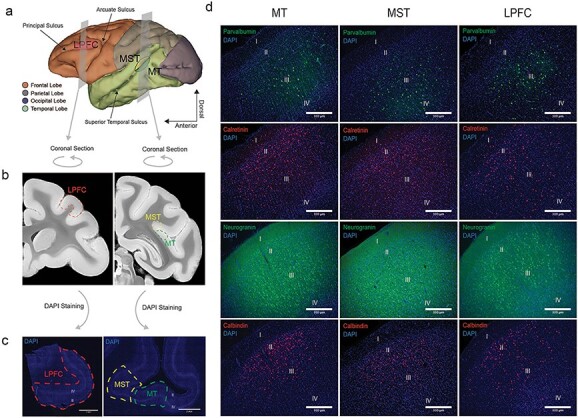
Figure 6 .

Landmarks for tissue extraction and immunohistochemistry images identifying the areas, layers, and neuronal types. (a) MRI reconstruction of the macaque monkey brain with coronal planes representing the regions of MT, MST, and areas 8A/46 that were extracted. (b) coronal images taken from the Calabrese et al. (2015) brain atlas that represent the cut surfaces of the extracted tissue blocks. (c) DAPI images of the sectioned tissue. Layers 2 and 4 can be identified as lighter bands. (d) Example immunohistochemistry images of PV, CR, P cells (Neurogranin), and CB (rows, from top to bottom) across areas MT, MST, and LPFC (columns, from left to right). The different cortical layers are labeled in each image.
