Figure 7 .

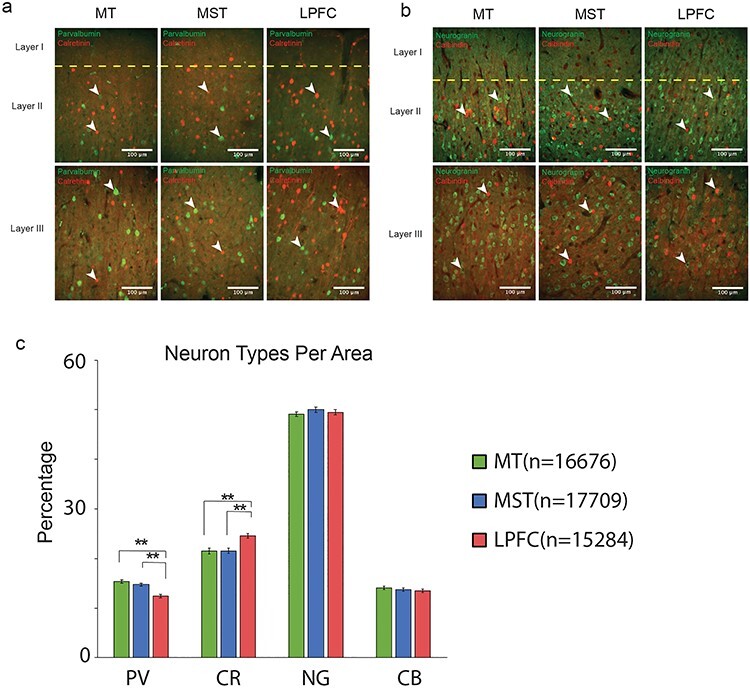
Immunohistochemistry, cell counting, and proportions. (a) Example magnified images of PV and CR used for cell counting. The different cortical layers and brain regions are labeled accordingly. (b) Example magnified images of P cells (Neurogranin) and CR interneurons used for counting. (c) Average percentages of PV, CR, P cells, and CB across MT, MST, and LPFC.
