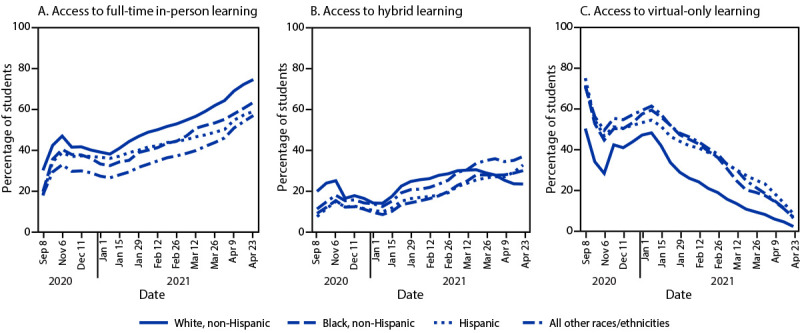
FIGURE 1.

Changes in access to full-time in-person (A), hybrid (B), and virtual-only (C) learning,* by race/ethnicity† — United States, September 2020–April 2021§,¶
* Learning modes are defined as “full-time in-person” (access to in-person learning 5 days a week), “hybrid” (access to part-time in-person learning), and “virtual-only” (no access to in-person learning; entirely online).
† Race/ethnicity data are based on district-level National Center for Education Statistics 2019–20 demographic data (https://nces.ed.gov/ccd/elsi). Hispanic students could be of any race. Students included in “All other races/ethnicities” include non-Hispanic students who are American Indian or Alaska Native, Asian or Pacific Islander, or two or more races.
§ Data before January 1, 2021, were collected less frequently and are not presented at weekly intervals. Data during January 1–April 23, 2021, are presented on a weekly basis. Date labels are condensed for readability.
¶ Access to full-time in-person learning increased significantly for all races/ethnicities (p<0.01 for all four regressions), access to hybrid learning increased significantly for all races/ethnicities (p<0.01 for all four regressions), and access to virtual learning decreased significantly for all races/ethnicities (p<0.01 for all four regressions).
