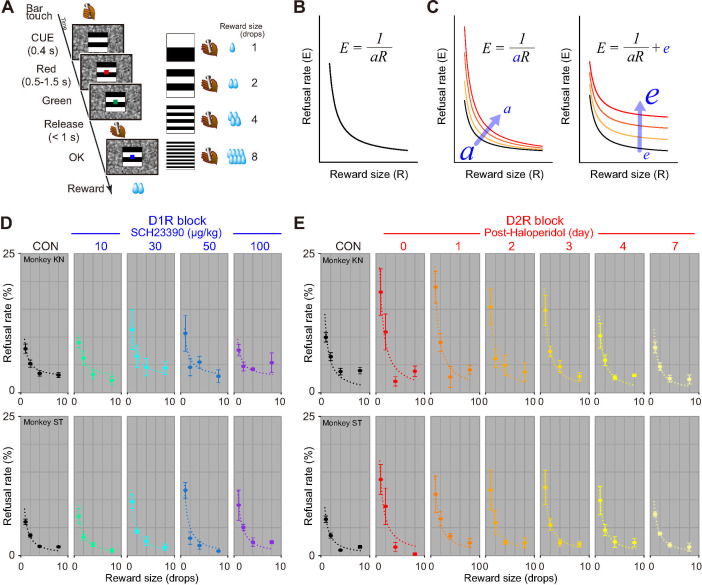
Fig 2. D1R/D2R blockade increased refusal rates in reward-size task.
(A) Reward-size task. Left: sequence of events during a trial. Right: association between visual cues and reward size. (B) Schematic illustration of inverse function between refusal rate and reward size. (C) Schematic illustration of 2 explanatory models of decrease in motivation. Left: increase in refusal rate (i.e., decrease in motivation) in relation to reward size caused by decrease in incentive impact (a). Right: an alternative model explaining increase in refusal rate irrespective of reward size. (D, E) Behavioral data under D1R and D2R blockade, respectively. Refusal rates (mean ± SEM) as a function of reward size for monkeys KN (top) and ST (bottom). Dotted curves are the best-fit inverse function (S1 Table). The data underlying this figure can be found on the following public repository: https://github.com/minamimoto-lab/2021-Hori-DAR. CON, control; D1R, D1-like receptor; D2R, D2-like receptor.

