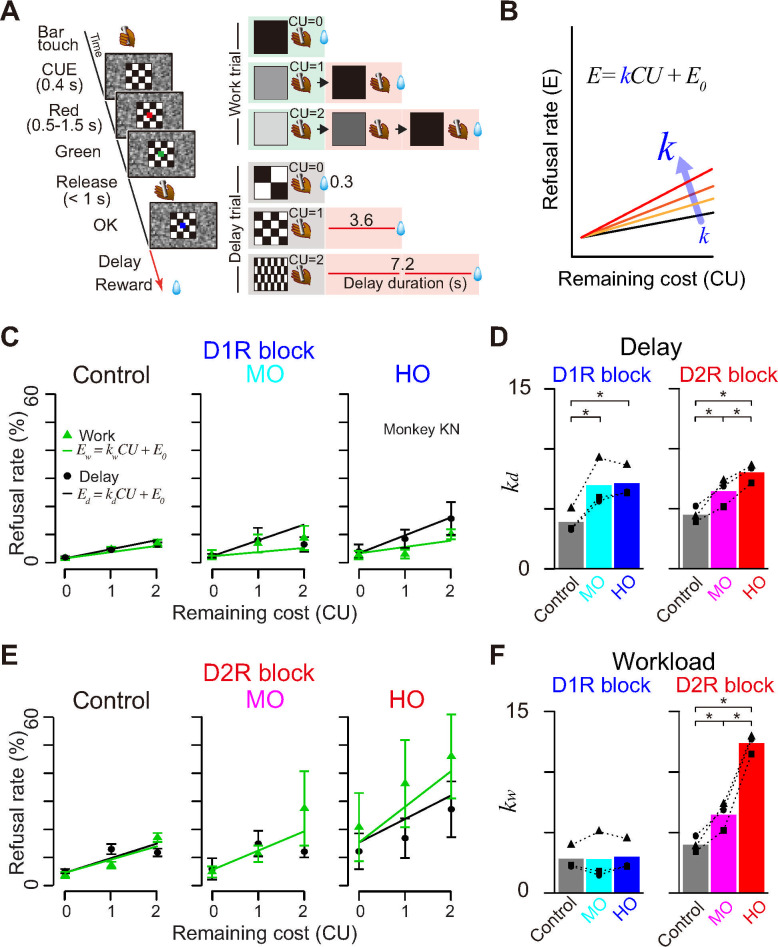
Fig 5. Differential effects of D1R and D2R blockade on cost-based motivational valuation.
(A) The work/delay task. The sequence of events (left) and relationships between visual cues and trial schedule in the work trials (right top 3 rows) or delay duration in the delay trials (right bottom 3 rows) are shown. CU denotes the remaining (arbitrary) cost unit to get a reward, i.e., either remaining workload to perform trial(s) or remaining delay periods. (B) Schematic illustration of an explanatory model of increases in refusal rate by increasing cost sensitivity (k). (C) Effects of D1R blockade. Representative relationships between refusal rates (monkey KN; mean ± SEM) and remaining costs for workload (green) and delay trials (black). Saline control (Control) and moderate (30 μg/kg; MO) and high D1R occupancy treatment condition (100 μg/kg; HO) are shown. Green and black lines are the best-fit lines for work and delay trials in model #1 in S3 Table, respectively. (D) Effects of D2R blockade. Nontreatment control (Control), moderate (1 day after haloperidol; MO) and high D2 occupancy treatment conditions (day of haloperidol; HO) are shown. Others are the same for C. (E) Comparison of effects between D1R and D2R blockade on delay discounting parameter (kd). Bars and symbols indicate mean and individual data, respectively. (F) Comparison of effects between D1R and D2R blockade on workload discounting parameter (kw). Asterisks represent significant difference (* p < 0.05, 1-way ANOVA with post hoc Tukey HSD test). The data underlying this figure can be found on the following public repository: https://github.com/minamimoto-lab/2021-Hori-DAR. D1R, D1-like receptor; D2R, D2-like receptor; HO, high occupancy; HSD, honestly significant difference; MO, moderate occupancy.

