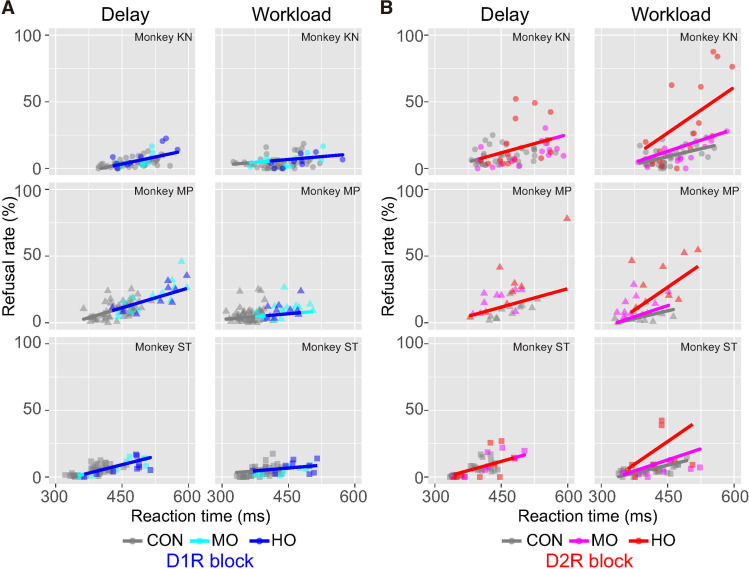
Fig 6. Relationship between refusal rate and RT in work/delay task.
(A) Relationship between refusal rate and average RT for each remaining cost in session by session for D1R blocking in delay and workload trials. Data are plotted individually for monkeys KN, MP, and ST, in order from top to bottom. Colors indicate treatment condition. Thick lines indicate linear regression lines. (B) Same as A, but for D2R blocking. Note that for the data in workload trials under D2R treatment, a linear model with random effect of condition (model #4 in S4 Table) was chosen as the best model to explain the data, whereas for the other data, a simple linear regression model (model #1, without any random effect or model #2 with random effect of subject) was selected. The data underlying this figure can be found on the following public repository: https://github.com/minamimoto-lab/2021-Hori-DAR. CON, control; D1R, D1-like receptor; D2R, D2-like receptor; HO, high occupancy; MO, moderate occupancy; RT, reaction time.

