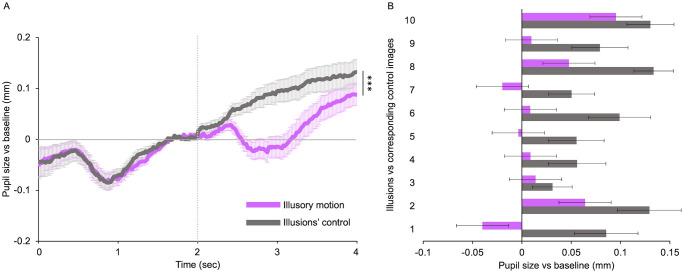
Fig 4. Control for illusory motion effect.
(A) Baseline-corrected pupil size for illusory motion and illusions’ control, plotted as a function of time from trial onset. The horizontal line represents the baseline: data over the zero-line represent pupil dilation whereas data under the line represent pupil constriction. The vertical line indicates the stimulus onset. Error bars are SE. Asterisks mark statistically significant comparison across image categories: *** p < 0.001. (B) Mean pupillary diameter for each illusion and the corresponding control image. Purple: motion illusions; grey: illusions’ control images. Error bars are SE.

