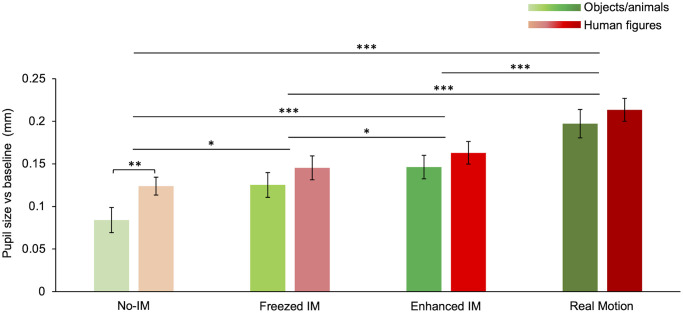
Fig 5. Pupillary response to different motion categories and stimulus content.
Comparison between the mean pupillary dilation for different motion categories and subjects (objects/animals’: green; humans: red). Color saturation of bars increases with motion strength, in order: No-IM, Freezed IM, Enhanced IM, Real Motion (see S1 List for stimuli). Error bars are SE. Asterisks mark statistically significant post-hoc comparisons: * p < 0.05, ** p < 0.01, *** p < 0.001. All data shown were corrected based on each observer’s motion rating test.

