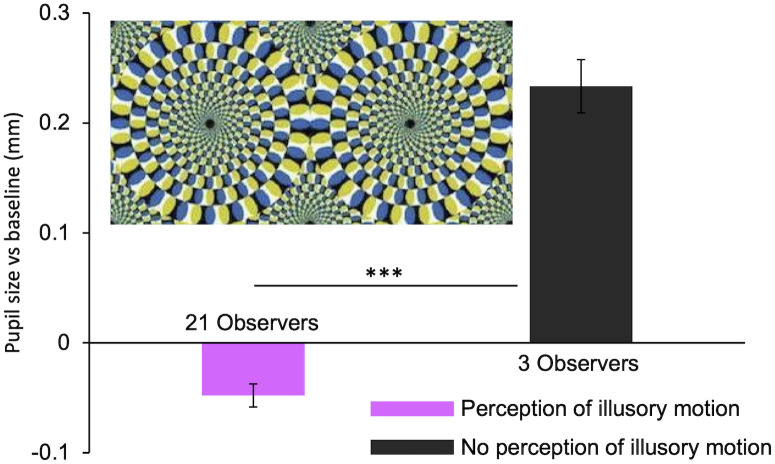
Fig 7. Effect of perception of illusory motion.
The image shown (n° 81 of S1 List) is the one scoring the highest number of misinterpretations (3). Asterisks mark statistically significant comparisons between groups, non-parametric one-tailed Mann-Whitney test, *** p < 0.001.

