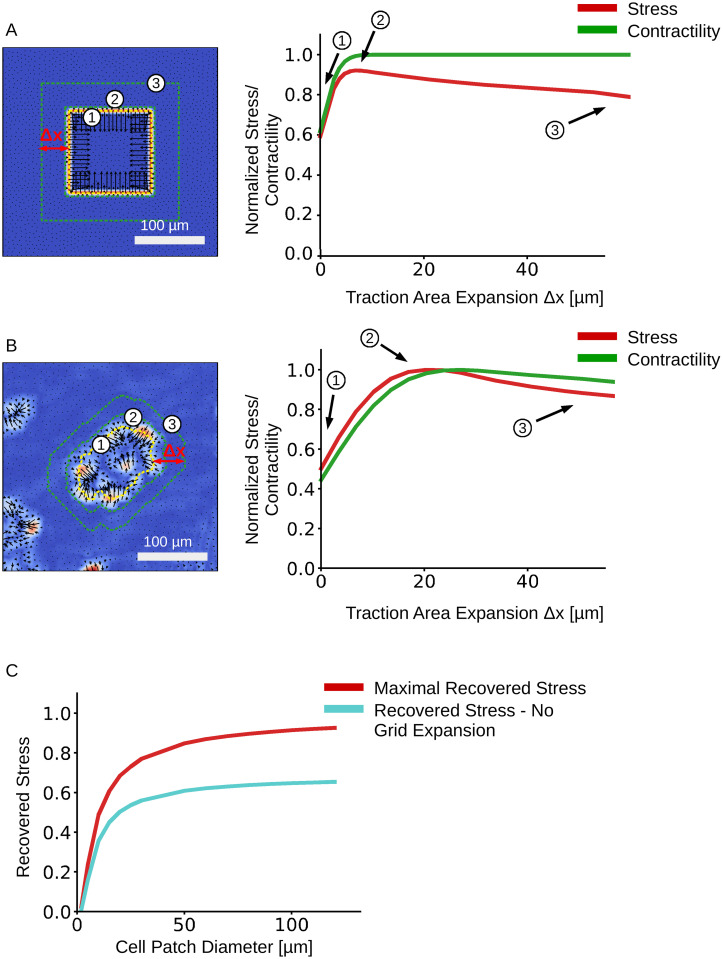
Fig 4. Effect of increasing the traction area on stress and contractility recovery.
The predicted traction fields of a synthetic test system (A) and an MDCK cell patch (B). The outlines of 3 representative FEM-grids are shown on the left. The relationship between average normal stress and FEM-grid area is shown on the right. C: Influence of the cell patch size of a synthetic data set on the maximally recovered mean normal stress with FEM-grid expansion (red), and the recovered mean normal stress without FEM-grid expansion (turquoise).

