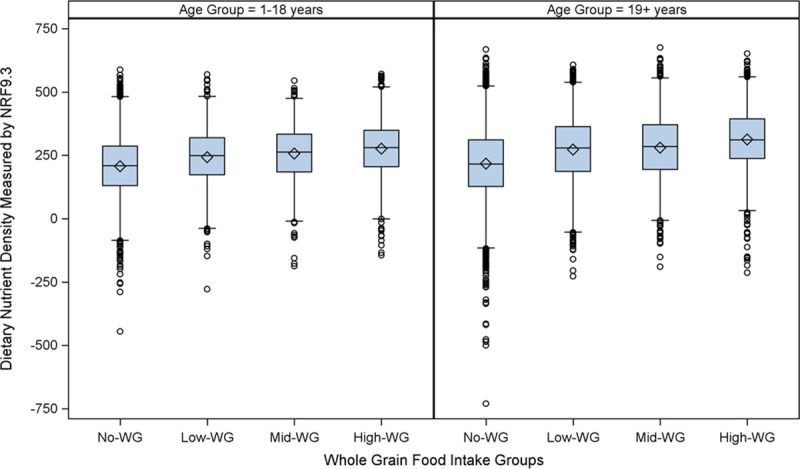
Fig 1. Diet quality, measured by the nutrient rich food index 9.3, among Canadian children and adults stratified by whole grain food intake.

Data are from the Canadian Community Health Survey (CCHS) 2015. The left panel shows results for children 1 to 18 years and the right panel shows results for adults 19 years and older. Data are presented as boxplots for the Nutrient Rich Food Index (NRF) 9.3 (displayed on the y-axis in arbitrary units), a measure of nutrient density adapted to the total diet that calculates the sum of the contribution to daily recommendations for nutrients to encourage (fiber, protein, vitamin D, vitamin C, iron, calcium, potassium, vitamin A, and magnesium) minus the sum of the contribution to daily recommendations for nutrients to limit (total sugar, sodium, and saturated fat) per 2000 kcals. Participants were stratified according to whole grain (WG) food consumption reported on a single 24 hr dietary recall. The no-WG group reported consuming no whole grain foods (children n = 3,305; adults n = 7,578); The remaining participants that consumed whole grains were divided according to age-specific tertiles into low-whole grain (low-WG; children n = 3,305; adults n = 7,578), mid-whole grain (mid-WG, children n = 1,077; adults n = 2,044) and high-whole grain (high-WG; children n = 1,101; adults 2,141) food intake. The boxplot displays the median (center line of the box), the mean (diamond), the 25th percentile (lower line of the box), the 75th percentile (upper line of the box), the 5st percentile (lower end of the whisker), the 95th percentile (upper end of the whisker), and outliers (open circles). Statistical significance was tested using linear regression adjusting for gender, age, BMI, low-income status, supplement use, and total dietary energy intake and we found a statistically significant (p<0.0001 for both children and adults) relationship between WG consumption status and diet quality, as measured by the NRF 9.3, as well as a statistically significant trend across groups of WG intake (p<0.0001).
