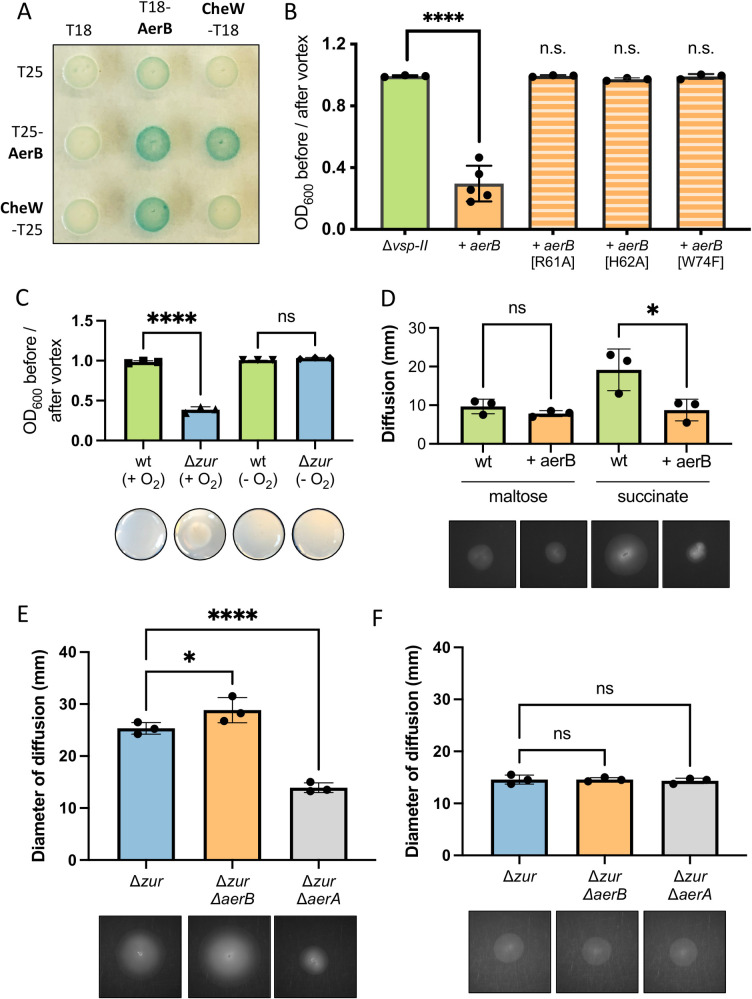
Fig 5. AerB encodes a methyl-accepting chemotaxis protein involved in energy taxis.
(A) In a bacterial two-hybrid assay, E. coli BTH101 was co-transformed with vectors carrying one domain of adenylate cyclase (T18 or T25) or an adenylate cyclase fusion with a protein of interest: CheW-T(18/25) or T(18/25)-AerB. Co-transformants were spotted onto an LB agar containing kanamycin and ampicillin (for selection), X-gal (for blue-white detection), and inducer (IPTG, 500 μM). Plates were incubated overnight at 30°C and for an additional day at room temperature. Blue color signifies positive protein-protein interactions. (B) Δvsp-II strains carrying an integrated, IPTG-inducible copy of either aerB or aerB point mutants (G385C, R61A, H62A, or W74F) were grown shaking overnight in M9 minimal medium supplemented with glucose (0.2%) and inducer (IPTG, 10 μM) at 30°C. Congregation was quantified by measuring the optical density (at 600 nm) of the culture supernatant before and after a brief vortex. (C) Wild-type and Δzur were grown overnight in 5 mL M9 minimal medium plus glucose (0.5%) and a terminal electron acceptor (fumarate, 50 mM). Cultures were grown aerobically (+ O2) or anoxically (- O2) shaking overnight at 30°C. Congregation was quantified as described above and representative images of the bottom of each culture tube are shown. (D) Wild-type and a strain carrying an inducible chromosomal copy of aerA (+ aerA) were grown overnight in LB medium and washed thrice in M9 minimal medium lacking a carbon source. A sterile toothpick was used to inoculate cells into M9 soft agar (0.3%) containing inducer (IPTG, 10 μM) and either succinate (30 mM) or maltose (0.1 mM) as a carbon source. The diameter of diffusion (mm) was measured following a 48-hr incubation at 30°C and representative diffusion patterns are shown for each strain. (E-F) Motility of Δzur, Δzur ΔaerB, and Δzur ΔaerA were measured as described above in (E) succinate and (F) maltose plates. Representative swarm diameters are shown. For all bar graphs, raw data points represent biological replicates, error bars represent standard deviation, and asterisks denote statistical difference via Ordinary one-way ANOVA test (****, p < 0.0001; *, p < 0.05; n.s., not significant).

