Fig 7.

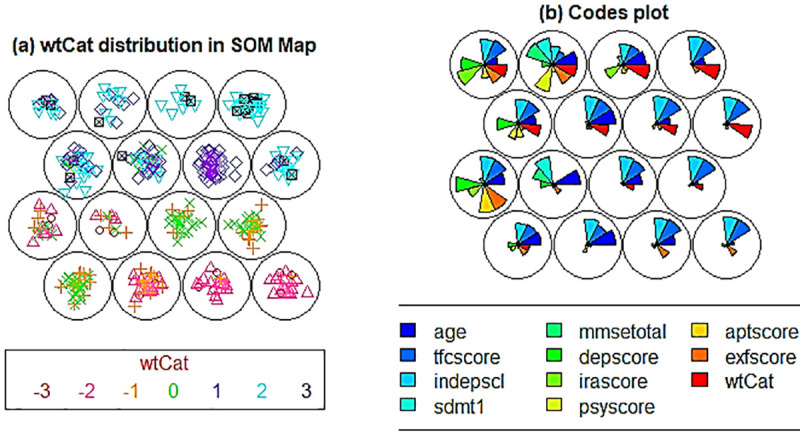
(a). Distribution of wtCat (-3 to +3) across the SOM nodes in fCont-HD subjects, (b). Codes plot indicating the distribution of combined factors (fCont-HD subjects) in SOM nodes.

(a). Distribution of wtCat (-3 to +3) across the SOM nodes in fCont-HD subjects, (b). Codes plot indicating the distribution of combined factors (fCont-HD subjects) in SOM nodes.