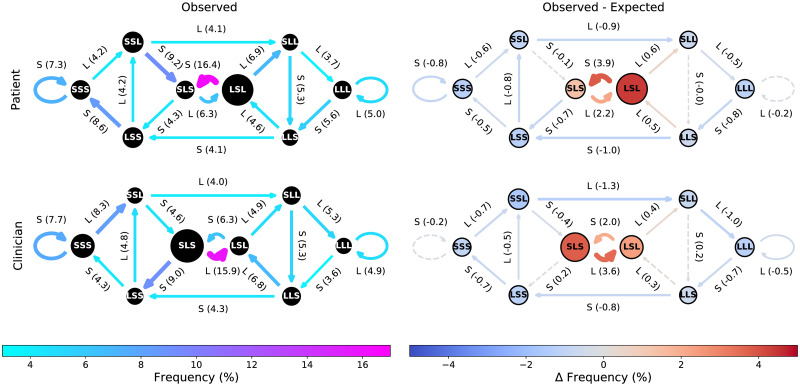
Fig 2. Normative patterns of information flow in the PCCRI corpus.
(Left column) CODYMs of normative patterns of information flow for patient turns (top) and clinician turns (bottom), averaged over the 117 PCCRI conversations analyzed (%Observed). (Right column) Difference CODYMS, where ΔFrequency = (%Observed) − (%Expected), for both patient turns (top) and clinician turns (bottom). In the difference CODYMs, state and transition frequencies where observed values are statistically significantly different from expected values (P <0.05, by empirically determined 95% confidence intervals for the null models) are indicated by outlining states in black solid (vs. dashed) circles and drawing transition arrows with solid (vs. dashed) lines.

