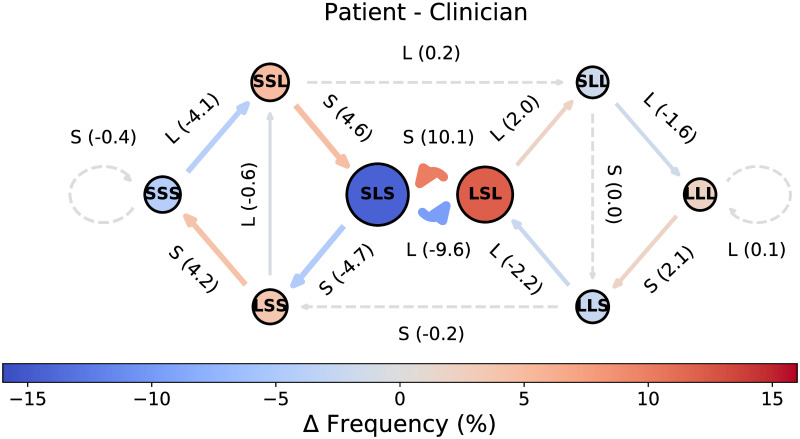
Fig 3. Differences in information flow between patient and clinician turns in the PCCRI corpus.
Difference CODYM, where ΔFrequency = (%Observed for Patient) − (%Observed for Clinician). State and transition frequency distributions that are statistically significantly different between patients and clinicians (P <0.05 by Mann Whitney U tests) are indicated by outlining states in black solid (vs. dashed) circles and drawing transition arrows with solid (vs. dashed) lines.

