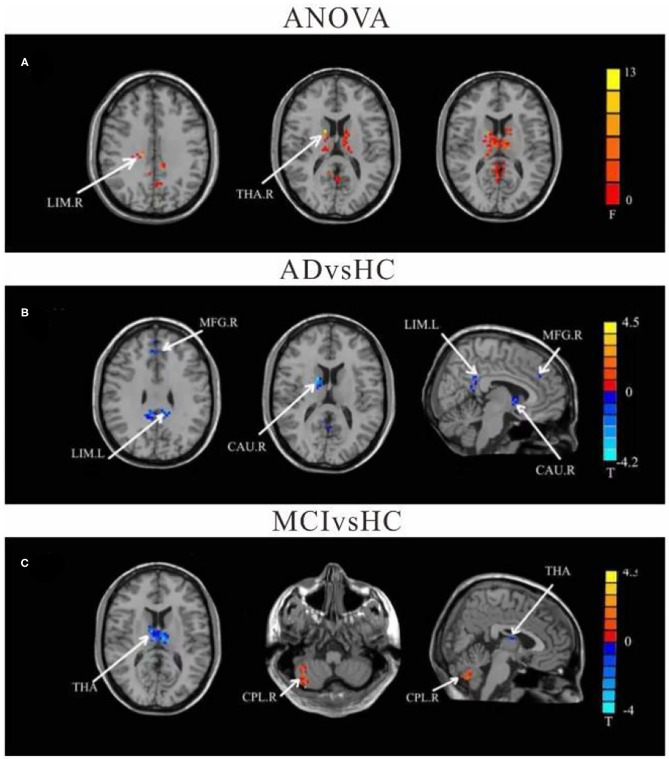
Figure 2.
Differences of FC values in the cerebellum left crus II. (A) Brain regions showing significant differences in FC of the left cerebellum crus II based on analysis of variance (ANOVA) analysis between HC, AD, and aMCI, p < 0.05, the cluster size > 100 voxels). (B,C) Results of post-hoc two-sample T-tests in voxel-wise analysis (Bonferroni corrected, cluster size ≥ 30 voxels, p < 0.05). AD, Alzheimer's disease; aMCI, amnestic mild cognitive impairment; HC, healthy controls; LIM, limbic lobe; THA, Thalamus; MFG, Middle Frontal Gyrus; CAU, Caudate; CPL, cerebellum posterior lobe; L, left; R, right.

