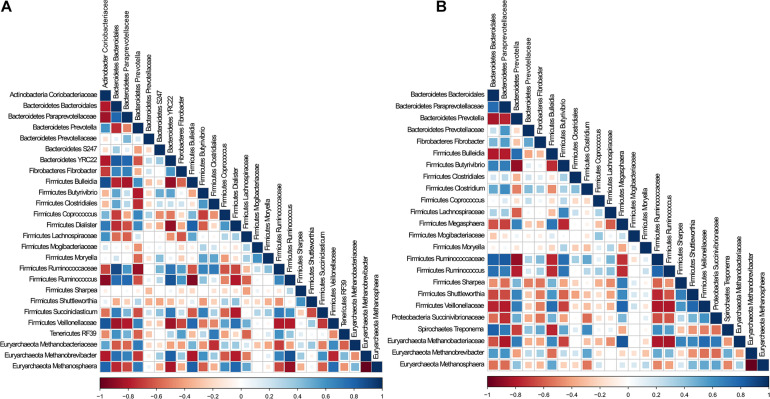
FIGURE 3.
Analysis of association patterns among microbial lineages scored using Spearman correlation for (A) DNA and (B) cDNA. Individual taxa were considered present in a sample if their sequence proportion was at least 0.01% of relative abundance. Correlations are shown by the color code (blue: positive correlations, red: negative correlations).

