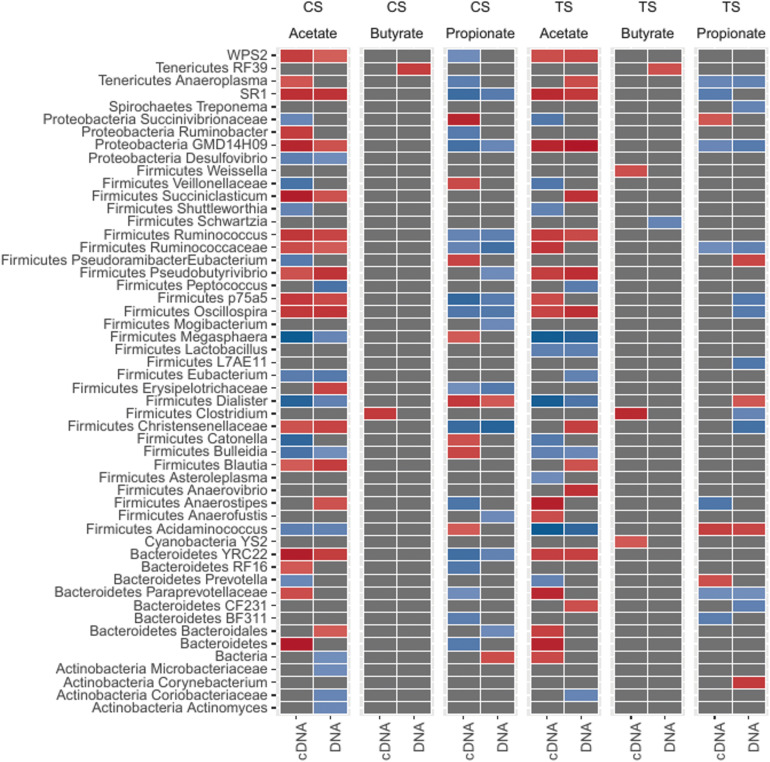
FIGURE 4.
Association pattern between bacterial genera and VFA (volatile fatty acids; acetate, butyrate, and propionate) based on Spearman’s correlations. Abundant bacterial taxa were selected (ANCOM test) and correlation coefficients (r) greater than 0.6 (+ve or –ve) and P ≤ 0.01 were considered significant. The red color indicates positive correlations (ranged from 0.6 to 0.8). The blue color indicates negative correlations (ranged from –0.6 to –0.8).

