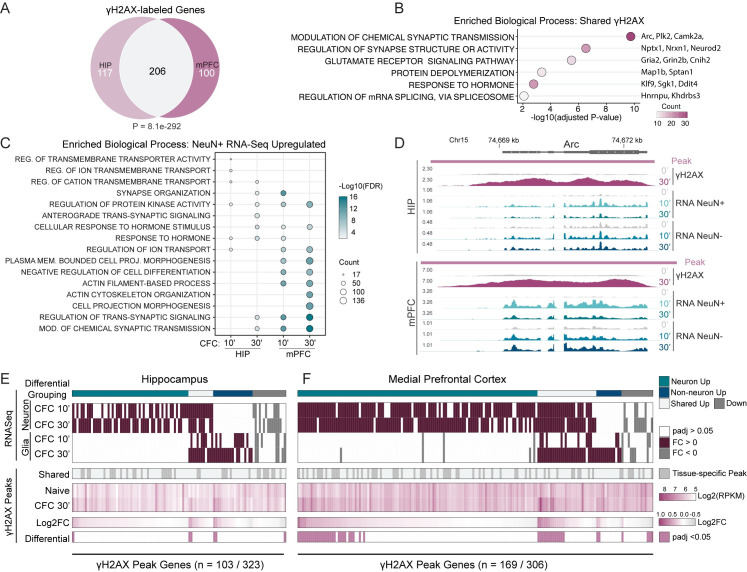
Fig 1. Fear learning induces DNA double-strand breaks in the brain.
(A) Venn diagram of the γH2AX peak-containing genes shared between HIP and mPFC for both naive and CFC conditions. P-value calculated using hypergeometric distribution test. (B) Six representative top biological processes for the 206 γH2AX peak-containing genes shared between HIP and mPFC in (A). Over-representation analysis with gene ontology (GO) category “Biological Process.” (C) The top 5 biological processes for the CFC-upregulated genes in NeuN+ nuclei at each 10- and 30-minute timepoint. Over-representation analysis with gene ontology (GO) category “Biological Process.” (D) Genome browser tracks for the gene Arc. Both HIP and mPFC are shown. Whole tissue γH2AX ChIP-Seq is shown as LogLR signal tracks (‘γH2AX’). Signal normalized total RNA-Seq from FACS-isolated nuclei is shown for neurons (‘RNA NeuN+’) and non-neurons (‘RNA NeuN-’). Time points following contextual fear conditioning are noted; naïve, 10, and 30 minutes (0’, 10’, 30’). γH2AX ChIP-seq tracks are the combined signal for 3–4 independent replicates, each replicate generated from the pooling of 3 animals. RNA-Seq tracks are the combined signal for 3–4 independent replicates. (E-F) Heatmaps of the genes containing γH2AX peaks that sustained transcriptional regulation after CFC. RNA-Seq heatmap denotes differential genes (‘RNA-Seq’) and color bar (‘Differential Grouping’) denotes cell type specificity. The γH2AX heatmaps show peaks shared between tissues (‘Shared’), RPKM of γH2AX signal, Log2FC, and those peaks changing after CFC with padj <0.05 (‘Differential’). Left is hippocampus (E), Right is mPFC (F).

