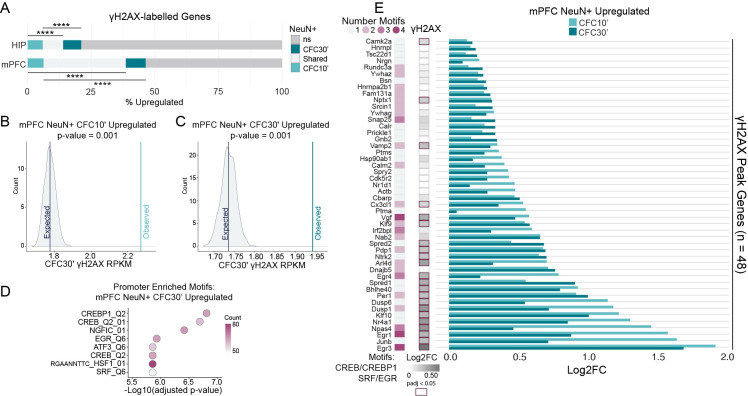
Fig 2. Activity-dependent genes are a source of DNA breaks in the brain.
(A) Percent overlap between genes containing a γH2AX peak and those that were upregulated (padj < 0.05) in neuronal nuclei after CFC. Hypergeometric distribution test; **** P <0.0001. (B-C) Permutation testing to assess whether CFC-upregulated genes at 10 minutes (B) or 30 minutes (C) have greater than expected γH2AX intensity, accounting for RNA expression level at the same time point (CFC30’). Distributions show the mean γH2AX intensity (RPKM) for 1000 permutations of random sampling, binned by RNA expression level (FPKM). Lines are the mean γH2AX RPKM of either all permutations (‘Expected’), or genes upregulated at the specified time point (‘Observed’). (D) Top 8 enriched promoter motifs for the genes upregulated in neuronal nuclei from mPFC 30 minutes after CFC (Log2FC >0 & FDR < 0.05). Using the “Transcription Factor Targets” (TFT) gene set from the molecular signatures database (MSigDB). (E) Select activity-associated motifs at the promoters of 48 upregulated genes with DSBs. Left, number of the specified motifs associated with each gene’s promoter. Center, γH2AX Log2FC, right, fold change observed after CFC in mPFC NeuN+ nuclei. Using the TFT gene sets from MSigDB for each transcription factor motif.

