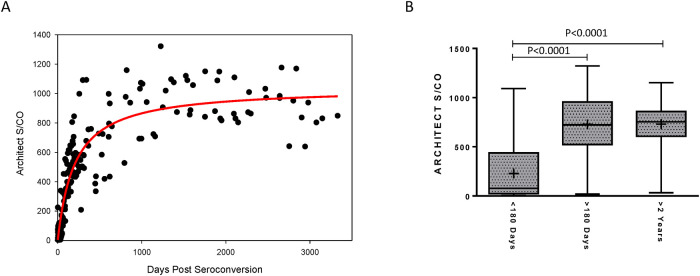
Fig 1. Longitudinal ARCHITECT HIV Ag/Ab combo signal-to-cutoff (S/Co) values from recent HIV-1 seroconverters.
(A) The S/Co ratios for longitudinally collected specimens from 26 antiretroviral therapy-naive recent seroconverters (N = 198) were plotted over days since estimated seroconversion. The solid red line represents the logarithmic curve fit to the data using non-linear regression. (B) Box plots show the 25th to 75th percentile of the S/Co ratios at indicated days post-seroconversion, while the middle lines represent the median values and whiskers represent the minimum and maximum values. The mean is indicated by “+”.

