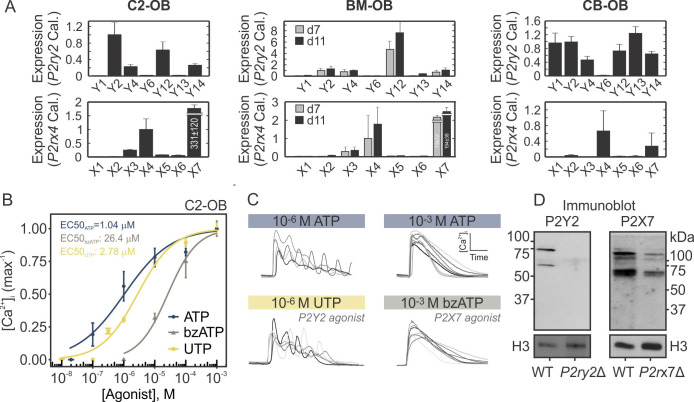
Fig 2. Functional P2Y2 and P2X7 are expressed in osteoblastic cells.
(A) P2 expression determined by RT-qPCR in C2-OB, BM-OB, and CB-OB. Relative transcript expression was calculated by ΔΔCT method, and P2ry2 and P2rx4 were used as calibrators for P2Y and P2X receptors, respectively. Data are means ± SEM, n = 3 independent cultures per cell line. (B) Fura2-loaded C2-OB cells were stimulated by ATP, UTP, or BzATP and [Ca2+]i response magnitudes were measured. Data are normalized means ± SEM (markers) fitted with hill functions (curves) for their dose-response curves. (C) Representative Ca2+ responses observed in C2-OB stimulated by 10−6 M ATP or UTP, and 10−3 M ATP or BzATP. (D) P2Y2 and P2X7 protein expression assessed by immunoblot in WT, P2ry2Δ and P2rx7Δ C2-OB whole cell lysates. Histone H3 was used as a loading control.

