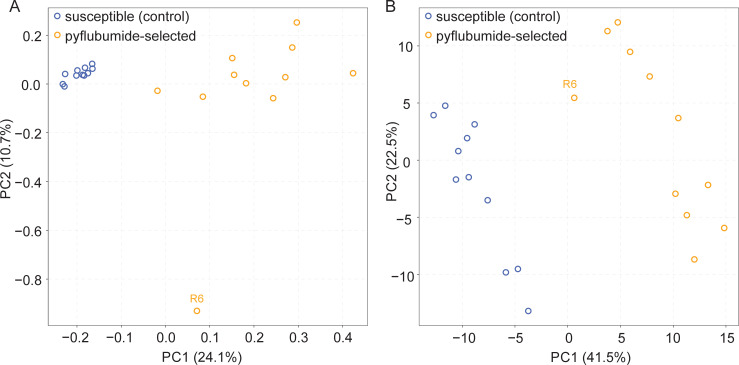
Fig 3. Selection for pyflubumide resistance is associated with a genomic and transcriptomic response.
(A) A principal component analysis of the eleven susceptible (control) and pyflubumide-selected populations using genome-wide allele frequency data at informative genomic loci. (B) A principal component analysis of the eleven susceptible (control) and pyflubumide-selected populations using genome-wide transcript levels. For both panels, each circle represents an individual population, the R6 population is labelled, treatment is color-coded as indicated (top left), and the percentage of explained variance is given in parentheses for each principal component (PC).

