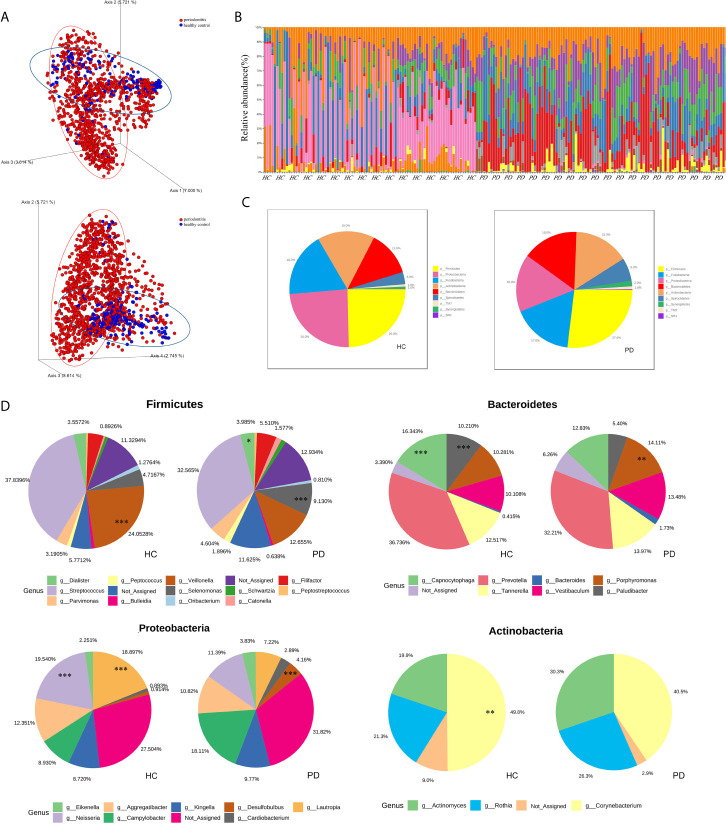
Figure 2.
(A) The 3D-PCoA plot based on Jaccard distance matrix (p<0.001, PERMANOVA) illustrates the beta diversity of oral microbiota. PD (periodontitis, red spots), HC (healthy control, blue spots). (B) The taxonomic bar plots on the phylum level. Each column represents a sample (HC left and PD right), and each small fragment in different colors represents different phyla. (C) The pie charts demonstrate the difference of microbial composition between HC (left) and PD (right) on the phylum level. Different colors correspond to the phyla on the list. (D) The subcategories composition of four phyla. Each pair of pie charts shows the comparison of microbial abundance between HC and PD on the genus level (*p < 0.05; **p < 0.01; ***p < 0.001, tested by RNA-seq methods, algorithm: edgeR).

