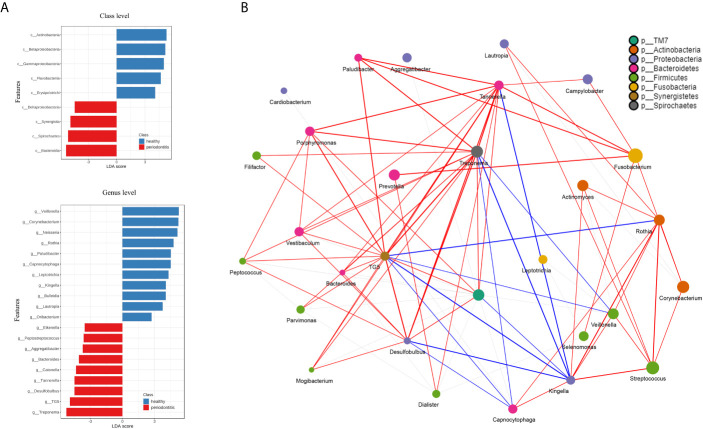
Figure 3.
(A) The ordinate is the taxa with significant differences between the groups, and the abscissa is a bar graph to visually display the LDA analysis logarithmic score value of each taxa. The longer the length, the more significant the difference in the taxon. Red bars indicate periodontitis and blue bars indicate healthy control. (B) The network analysis shows the correlation between microorganisms on the genus level. Each genus is colored according to its phylum. The edges show greater correlations and the node size reflects the abundance. Red and blue lines represent positive and negative correlations, respectively.

