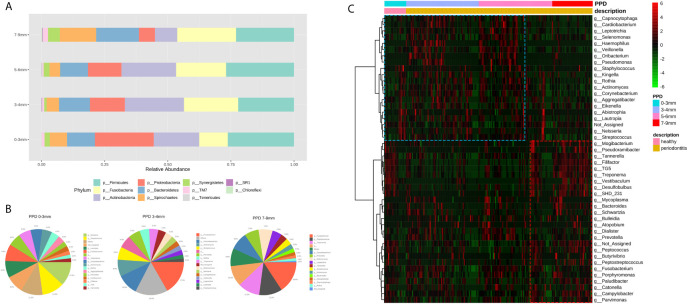
Figure 4.
(A) The taxonomic bar plots on the genus level. Each bar represents a group of different periodontal probing depth (0–3 mm, 3–4 mm, 5–6 mm, and 7–9 mm). (B) Three pie charts display the genera (abundance >1%) in the sites of PPD 0–3 mm, 3–4 mm, and 7–9 mm. The taxonomy “others” is a cluster of genera whose abundance are less than 1%. (C) The heatmap shows the correlations between taxa and PPD. Each column represents a sample, each row represents a taxon, and each lattice represents a correlation coefficient between a taxon and PPD group (red lattice, positive correlation; green lattice, negative correlation). With the deepening of pocket depth, the pathobionts increase (red box) and some normal microbes decrease (blue box).

