Figure 1.
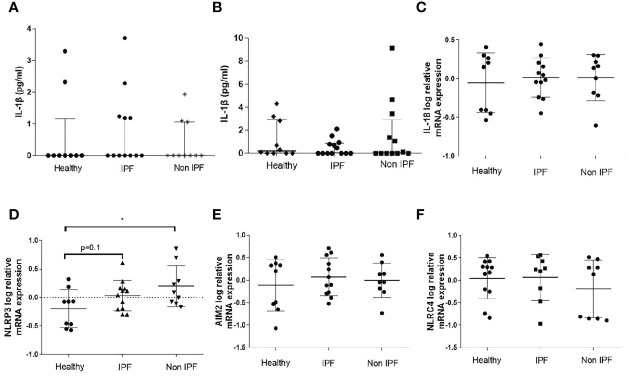
Baseline characterization of the Inflammasome in BALF cells. (A) IL-1β protein concentration in BAL fluid as measured by ELISA and (B) IL-1β protein release by unstimulated AMs (5-hour culture). Data represented as median with interquartile range Mann-Whitney test. Relative log mRNA expression in unstimulated BALF cells (C) IL18 (D) NLRP3, (E) AIM2, (F) NLRC4. Data represented as mean ± SD, t-test. *p<0.05.

