Figure 3.
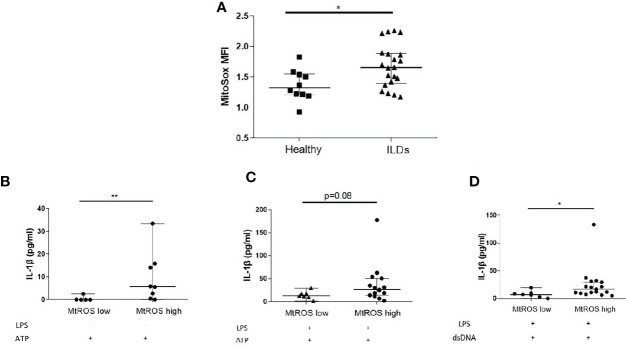
Mitochondrial Oxidation status and the inflammasome. (A) MtROS Mean Florescence Intensity Index (MFI) as assessed by flowcytometry in healthy and ILD patients. ILD Patients were categorised according to MtROS MFI using the cut-off value of 1.5(generated by ROC curve). Comparisons on inflammasome activation were made in MtROS high and low groups (B) NLRP3 activation without LPS priming, (C) NLRP3 activation with LPS priming, (D) AIM2 activation (LPS priming followed by dsDNA transfection). Data presented as median with interquartile range, *p<0.05, **p<0.005, Mann-Whitney test.

