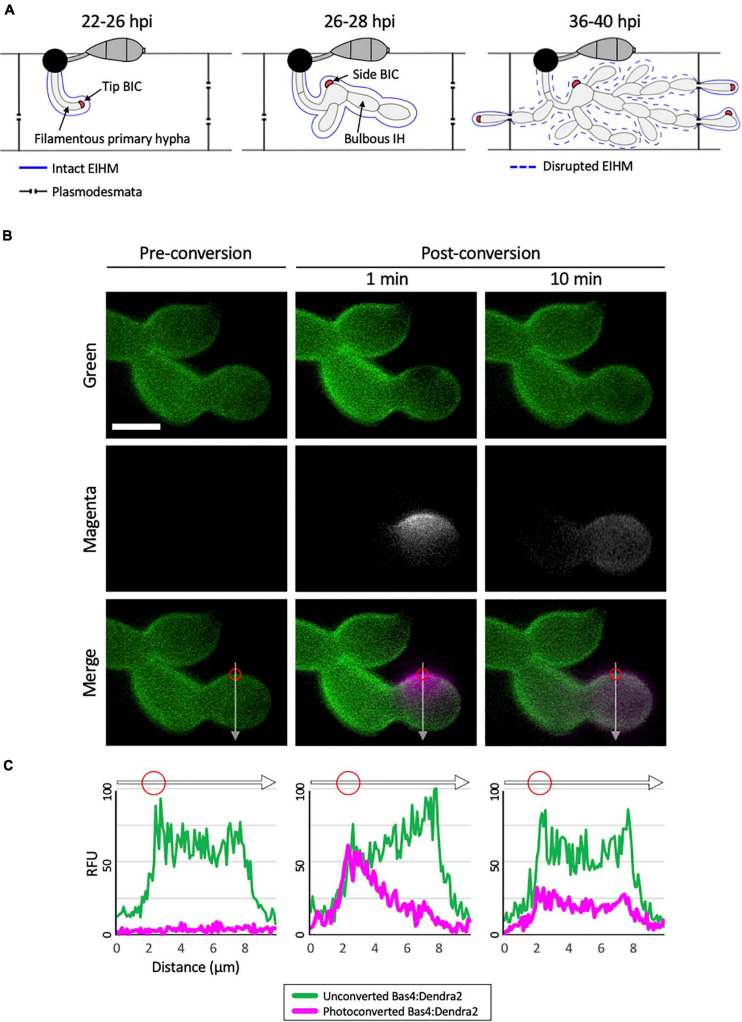
FIGURE 1.
Bas4 is freely diffusible inside the EIHMx. (A) Schematic diagram summarizing the invasion of first and second rice cells by M. oryzae invasive hyphae (IH). At 22–26 h post inoculation (hpi), a filamentous primary hypha grows in the first-invaded host cell, where it is surrounded by an intact EIHM. Apoplastic effectors secreted by IH are retained within the EIHMx. In contrast, cytoplasmic effectors enter the host cytoplasm and show preferential accumulation at the tip BIC located at the apex of the primary hypha. At 26–28 hpi, the filamentous primary hypha switches to depolarized, asymmetric growth, leaving the BIC subapically associated with the first bulbous IH cell, becoming a side BIC. Polarized growth resumes from the BIC-associated cell, producing bulbous IH. The EIHM remains intact. At 36–40 hpi, the EIHM in the first-invaded host cell is disrupted, and IH invade neighboring host cells. Every IH that invades an adjacent rice cell is surrounded by a new EIHM and associated with a new BIC. (B) IH of M. oryzae CKF1737 expressing EIHMx-localized effector Bas4 fused to the green-to-red photoconvertible fluorescent protein Dendra2, invading a rice cell at 29 hpi. Shown are single plane confocal images of separate fluorescence (top and middle panels) and merged fluorescence (bottom panels). Left: Before photoconversion, green Bas4:Dendra2 fluorescence localized throughout the EIHMx. Middle: 1 min after selective photoconversion (region indicated by the red circle), red Bas4:Dendra2 fluorescence (magenta and pseudo-colored white) diffused into the surrounding EIHMx. Right: 10 min after photoconversion, the red Bas4:Dendra2 further diffused. White arrows indicate the locations of fluorescence intensity linescans shown in panel (C). Bar = 5 μm. (C) Linescans showing the relative fluorescence intensity between unconverted Bas4:Dendra2 (green) and photoconverted Bas4:Dendra2 (magenta), corresponding to the location of the white lines in panel (B). Red circles show the photoconverted region in panel (B). Units are relative fluorescence units (RFU; y-axis) and distance in μm (x-axis).

