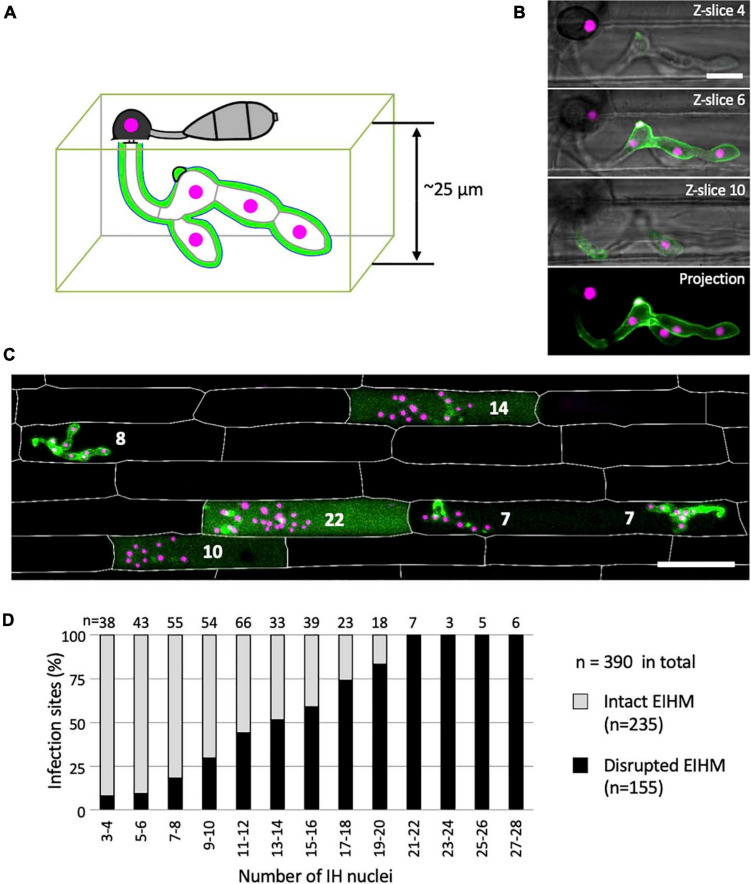
FIGURE 4.
The occurrence of EIHM disruption increases proportionally with nuclear stage. (A) Schematic diagram three-dimensionally depicting an epidermal rice cell invaded by M. oryzae expressing sec-GFP (green) and nuclear tdTomato (magenta). (B,C) Confocal images of rice cells invaded by M. oryzae CKF2187 expressing sec-GFP (green) and nuclear tdTomato (magenta). (B) Images of the same infection taken at different focal planes. The top three panels show merged fluorescence and bright-field from individual focal planes (indicated in the top right corner), while the last panel shows a merged fluorescence projection of all focal planes; 12 z-slices in total spanning 24 μm over the z-axis. Note that all five fungal nuclei are fully visible only in the projection view. Bar = 10 μm. (C) A merged fluorescence projection of infected rice cells at 30 hpi showing different patterns of sec-GFP localization at different IH growth stages determined by the nuclear number for each infection (white numbers). The infection to the far left shows EIHMx-localized sec-GFP (intact EIHM), while the other infections show host-localized sec-GFP (disrupted EIHM). Note the infected rice cell at the bottom right was invaded by two separate appressoria. Rice cell walls are indicated by white outlines. Bar = 50 μm. (D) A plot of the frequency of EIHM disruption according to fungal nuclear number for 390 infections of M. oryzae CKF2187 in the first-invaded host cell between 28 and 33 hpi. Sec-GFP localization patterns revealed the distribution of intact (n = 235) and disrupted (n = 155) EIHMs (y-axis) at each group of two nuclear stages (x-axis).

