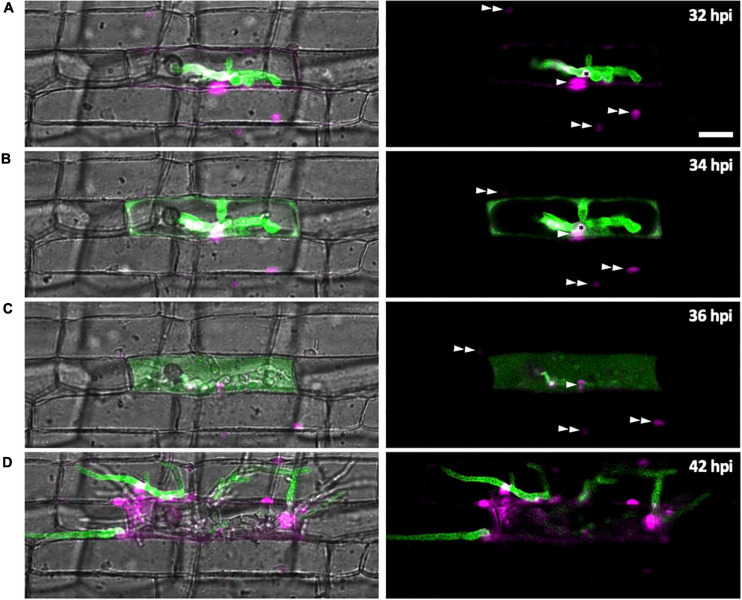
FIGURE 7.
Effector localization changes during invasion of the first few host cells. M. oryzae CKF1616 expressing apoplastic effector Bas4:EGFP (green) along with cytoplasmic effector Pwl2:mCherry:NLS (magenta) invading rice. Shown are single plane merged fluorescence and bright-field (left panels), and merged fluorescence alone (right panels) confocal images of a time-lapse series from 32 to 42 hpi. Asterisk = BIC. Single white arrowhead = first-invaded host cell nucleus with Pwl2:mCherry:NLS fluorescence. Double white arrowhead = nuclei of uninvaded host cells with Pwl2:mCherry:NLS fluorescence. (A) During the early stage of invasion, the EIHM was still intact, causing Bas4:EGFP to be retained within the EIHMx. Pwl2:mCherry:NLS was localized at the BIC, in the nucleus of the invaded cell, and in the nuclei of a few nearby cells. (B) The EIHM was disrupted, causing Bas4:EGFP to spill into the rice cytoplasm. (C) The vacuole ruptured, causing spilled Bas4:EGFP to homogenize throughout the host cell lumen. (D) IH invaded neighboring cells with Bas4:EGFP retained by new EIHMs. Pwl2:mCherry:NLS fluorescence increased upon invasion of neighboring host cells. By this time the first-invaded cell lacks significant levels of fluorescence. Bar = 20 μm.

