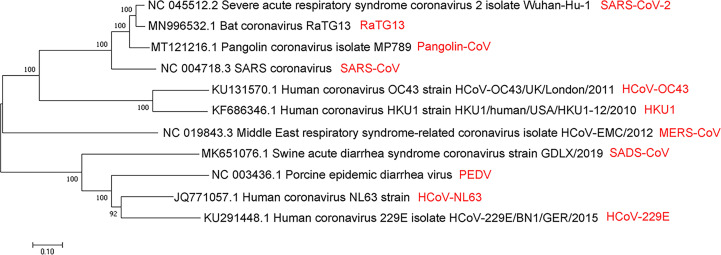
Figure 1.
Evolutionary relationships of SARS-CoV, MERS-CoV, SARS-CoV-2, and several viruses from α- and β-coronavirus categories by the neighbor-joining method. A coronaviruses’ phylogenetic tree is shown based on the full-length genome sequence. All complete genome sequences of the coronavirus are downloaded from the NCBI reference sequence database RefSeq. The evolutionary relationship analysis involves 11 nucleotide sequences, including SARS-CoV, MERS-CoV, SARS-CoV-2, RaTG13, pangolin-CoV, HCoV-OC43, HKU1, SADS-CoV, PEDV, HCoV-NL63, and HCoV -229E. By using the neighbor-joining method, the evolutionary history was inferred. The optimal tree is shown, with the sum of branch length = 3.61257103. Next to the branches are shown the percentage of replicate trees (50 replicates) where the associated taxa are clustered together in the bootstrap test. The tree is drawn to scale, and its branch length is the same as the units used to infer the evolutionary distance of the phylogenetic tree. The phylogenetic tree is drawn by MEGA7.

