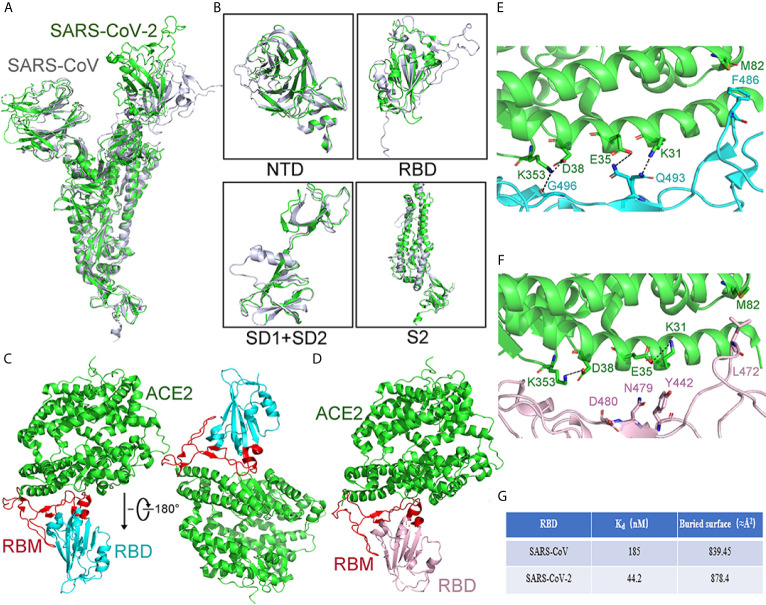
Figure 7.
Comparison of the S protein in SARS-CoV-2 and SARS-CoV. (A) Compared whole S protein between SARS-CoV-2 and SARS-CoV. SARS-CoV-2 and SARS-CoV are shown in green and gray, respectively. (B) Compared different domains of S protein between SARS-CoV and SARS-CoV-2. Structural domains from SARS-CoV-2 S protein have been aligned with the domain from SARS-CoV S as follows: NTD (top left), RBD (top right), SD1, and SD2 (bottom left), and S2 (bottom right). SARS-CoV and SARS-CoV-2 are shown in gray and green, respectively. (C) The overall structure of the SARS-CoV-2 RBD with ACE2 from the side view. ACE2 is shown in green. The SARS-CoV-2 RBD is shown in cyan and RBM in red. (D) The overall structure of the SARS-CoV RBD with ACE2 from the side view. The SARS-CoV RBD is shown in pink and RBM in red. ACE2 is shown in green. (E) The structural details of the interface between ACE2 and SARS-CoV-2 RBM. The interface between the SARS-CoV-2 RBM and ACE2 has been shown. The SARS-CoV-2 RBM is shown in cyan. ACE2 is shown in green. (F) The structural details of the interface between ACE2 and SARS-CoV RBM. The interface between SARS-CoV RBM and ACE2 has been shown. ACE2 is shown in green. The SARS-CoV RBM is shown in pink. (G) Compared Kd value and buried surface between the SARS-CoV RBD or SARS-CoV-2 RBD with ACE2. The value buried area is calculated as the average value. All structures are drawn by Pymol.

