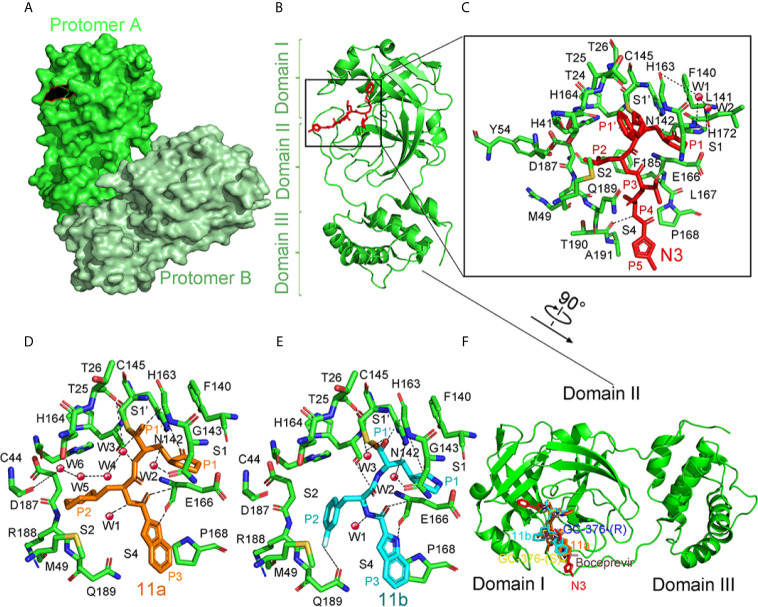
Figure 9.
The crystal structure of SARS-COV-2 virus Mpro in complex with inhibitors. (A) Surface representation of the homodimer of Mpro. Protomer A is in green, and protomer B is in pale green. (B) Cartoon representation of one protomer of the dimeric Mpro-inhibitor complex. The protomer is in green. N3 is in red sticks. (C) A zoomed view for the substrate-binding pocket. The key residues, which form the binding pocket, are shown as green sticks, the two waters, assigned as W1 and W2, are shown as red spheres. Four subsites, S1′, S1, S2, and S4, are labeled. P1, P1′, P2, P3, P4, and P5 sites of N3 are shown. Hydrogen bonds are indicated as dashed lines. (D) Close-up view of the 11a binding pocket. The residues involved in inhibitor binding are shown as green sticks. 11a and water molecules are shown as orange sticks and red spheres, respectively. Four subsites, S1′, S1, S2, and S4, are labeled. P1, P1′, P2, and P3 sites of 11a are indicated. Hydrogen bonds are indicated as dashed lines. (E) Close-up view of the 11b binding pocket. 11b and water molecules are shown as cyan sticks and red spheres, respectively. Four subsites, S1′, S1, S2, and S4, are labeled. P1, P1′, P2, and P3 sites of 11b are indicated. Hydrogen bonds are indicated as dashed lines. (F) Comparison of the inhibitor binding modes in SARS-CoV-2 Mpro. Two configurations (S and R) of GC-376, 11a, 11b, N3, and Boceprevir are shown in yellow, blue, orange, cyan, red, and dirty violet, respectively. All structures are drawn by Pymol.

